Figures & data
Figure 1. Temperature profile during heating of FSaII tumours with Oncothermia. T1: Intratumour temperature determined with a thermal probe inserted into the middle of tumour, T2: temperature of the skin surface over subcutaneous tumours determined by placing a thermal probe between the tumour and upper heating electrode, T3: temperature of the skin surface determined by placing a thermal probe between the mouse and lower electrical plate on which the mouse was placed.
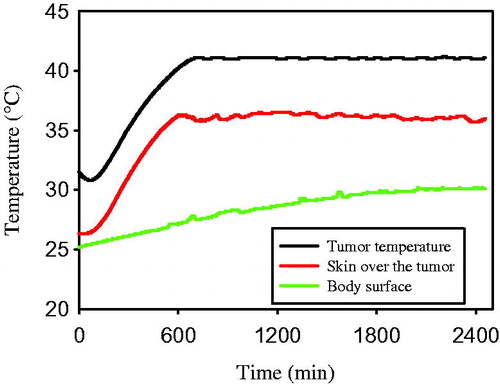
Figure 2. Changes in tumour volume after various treatments. Data represent mean volumes of 7–9 tumours ±1 SE. *indicates p < 0.05.
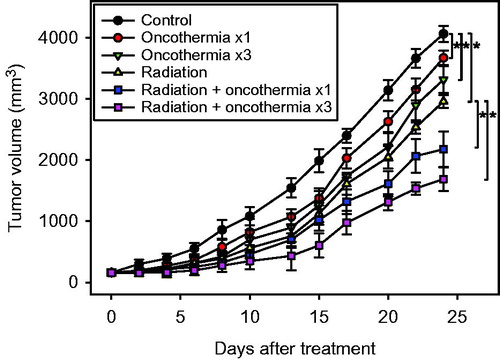
Figure 3. Assay of tumour growth delay with different sequences of heating and irradiation. Data indicate mean volumes of 7–9 tumours ±1 SE. *indicates p < 0.05.
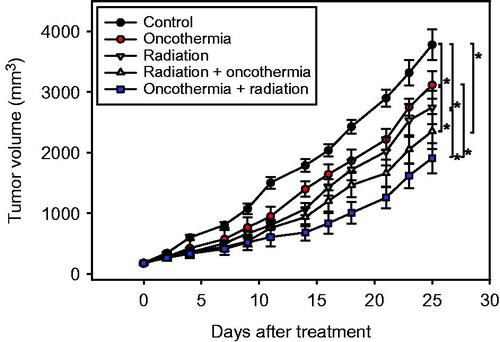
Figure 4. (A) TUNEL-positive apoptotic cells in FSaII tumours three days after various treatments. Arrows indicate apoptotic cells. (B) Apoptotic index (%) three days after treatments. The number of apoptotic cells (total of 1000 nuclei) in 10 fields randomly selected in each of three tissue sections per tumour was obtained. Means of five tumours ±1 SE are shown. *indicates p < 0.05.
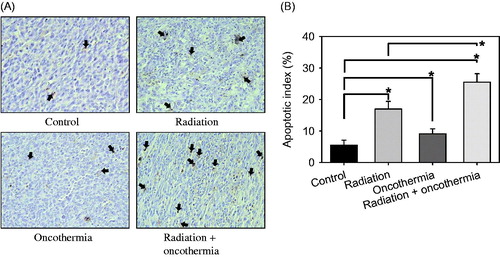
Figure 5. (A) Immunofluorescence images of hypoxia and blood perfusion in FSaII tumours three days after treatment. Radiation: Tumours were irradiated with 15 Gy. Oncothermia: Tumours were heated once at 41 °C for 30 min. Radiation + Oncothermia: Tumours were irradiated with 15 Gy and immediately heated once at 41 °C for 30 min. Hypoxic areas were labelled with pimonidazole (green) and blood perfusion assessed using Hoechst 33342 (blue). (B) Areas positive for Hoechst 33342 (perfusion) and pimonidazole (hypoxia) in tissue sections were quantified using Image J software. Five fields in each of the three tissue sections per tumour were studied and the % positive area calculated. Means of five tumours ±1 SE are shown. *indicates p < 0.05.
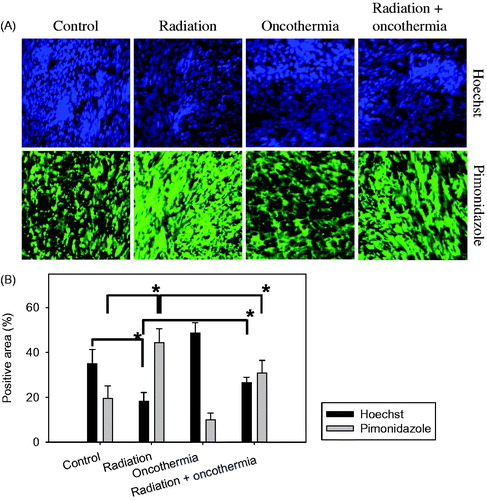
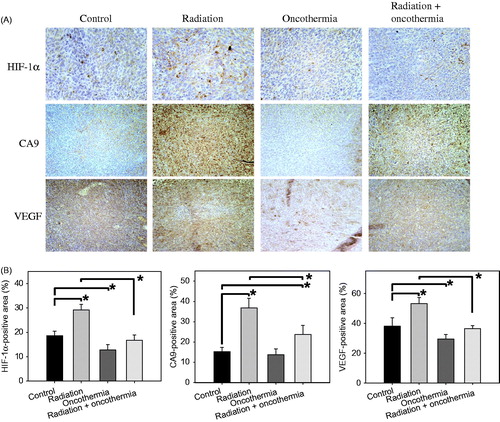
Figure 6. (A) Immunohistological staining for HIF-1α, CA9 and VEGF in FSaII tumours three days after treatment. Radiation: Tumours were irradiated with 15 Gy. Oncothermia: Tumours were heated once at 41 °C for 30 min. Radiation + Oncothermia: Tumours were irradiated with 15 Gy and heated once at 41 °C for 30 min (B). Expression of HIF-1α, VEGF and CA9 was quantified using Image J 1.38× software (Rasband, W.S., Image J, US National Institutes of Health, Bethesda, MD). Ten images were captured for each of the three tissue sections per tumour and % positive areas calculated. Means of 4–6 tumours ±1 SE are shown. *indicates p < 0.05.