Figures & data
Table 1. Clinical features of the patients and tumours.
Table 2. Parameters of the hydrodissection and ablation procedure.
Figure 1. A 67-year-old man with histopathologically a proven clear cell carcinoma renal tumour on the right side. (A) Transverse contrast enhanced MRI reveals a 1.3-cm hypoenhancement tumour (arrow) located on the ventral side of the right kidney adjacent to the colon (curve arrow) before the MWA. (B) After the saline injection hydrodissection (solid triangle), the colon (curve arrow) is successfully separated from the renal tumour (arrow) on US imaging. (C) Transverse contrast-enhanced MRI 3 months after the MWA reveals that the tumour adjacent to the colon (curved arrow) is completely ablated (arrow). (D) Transverse contrast-enhanced MRI 6 months after the MWA reveals the completely ablated tumour (arrow) adjacent to the colon (curved arrow) shrinkage.
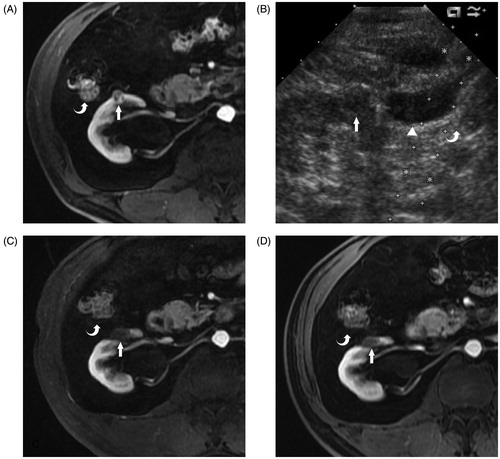
Table 3. Complications and side effects.
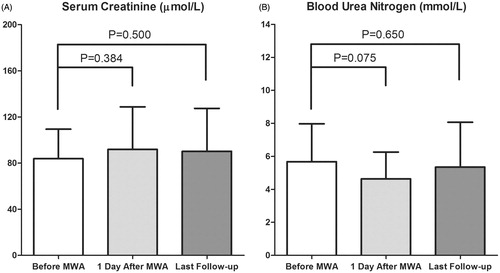
Figure 2. The changes in renal function. (A) There was no significant difference in the mean serum creatinine level 1 day after the MWA (p = 0.384) and at the last follow-up (p = 0.500) compared with that prior to the MWA. (B) No significant differences in the mean blood urea nitrogen were observed 1 day after the MWA (p = 0.075) and at the last follow-up (p = 0.650) compared with that before the MWA.