Figures & data
Table 1. Volumes of SWS, MNP-DMSA work solution and SP-TALP + medium used to form each group.
Figure 1. Motility (A) and progressive motility (B) of bull sperm in the control and treated groups during the incubation period for 240 min. CO – control group; G0.015: Group treated with MNP-DMSA at the concentration of 0.015 mg Fe/mL; G0.03: Group treated with MNP-DMSA at the concentration of 0.03 mg Fe/mL; G0.06: Group treated with MNP-DMSA at the concentration of 0.06 mg Fe/mL.
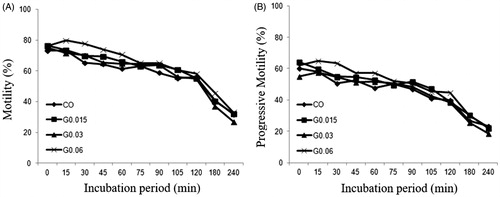
Table 2. Motility and progressive motility (mean ± SD) of bull sperm in the control and treated groups during the incubation period for 240 min.
Figure 2. Qualitative parameters of sperm movement (mean ± SEM) during the incubation period. (A) STR – straightness coefficient (%), (B) LIN – linearity coefficient (%), (C) BCF – frequency of head displacement (Hz) and (D) ALH – lateral head amplitude (μm). *Indicates significant difference from time 0 (p < 0.05).
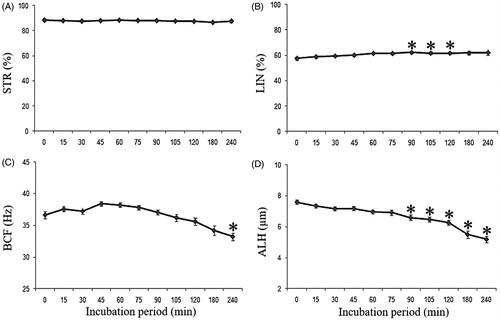
Figure 3. Velocity parameters of sperm movement (mean ± SEM) during the incubation period. (A) VAP – mean velocity (μm/s), (B) VSL – linear velocity (μm/s) and (C) VCL – curvilinear velocity (μm/s). *Indicates significant difference from time 0 (p < 0.05).
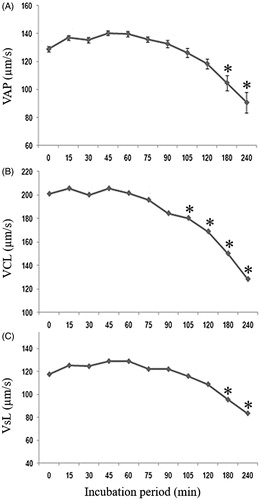
Figure 4. Percentages (media ± SD) of (A) viable sperm cells, (B) non-viable sperm cells and (C) sperm cells with intact membrane and reacted acrosome during the incubation period with or without MNP-DMSA. a,bDifferent letters indicate significant difference among times in the same group (p < 0.05). CO – control group; G0.015: Group treated with MNP-DMSA at the concentration of 0.015 mg Fe/mL; G0.03: Group treated with MNP-DMSA at the concentration of 0.03 mg Fe/mL; G0.06: Group treated with MNP-DMSA at the concentration of 0.06 mg Fe/mL.
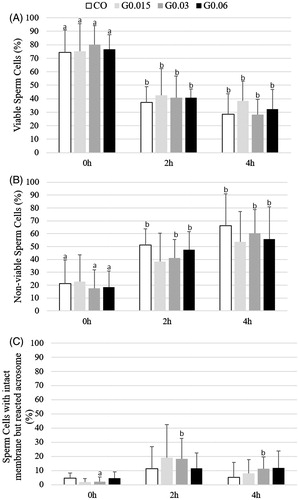
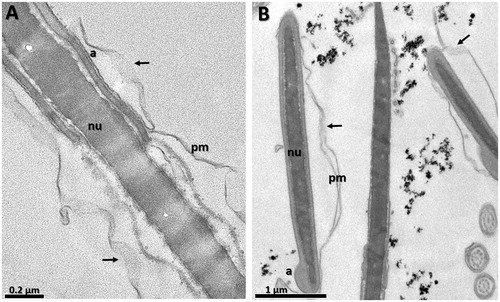
Figure 5. Transmission electron micrographies of bull spermatozoa after 4 h of incubation. (A) CO – control group, (B) G0.015: Group treated with MNP-DMSA at the concentration of 0.015 mg Fe/mL, (C) G0.03: Group treated with MNP-DMSA at the concentration of 0.03 mg Fe/mL and (D) G0.06: Group treated with MNP-DMSA at the concentration of 0.06 mg Fe/mL. Note the presence of MNP-DMSA clusters close to the head of the sperm cells in all treated groups (arrows). Nanoparticles were not observed inside the sperm cytoplasm. pm: plasmatic membrane, a: acrosome, nu: nucleus, h: head, t: tail.
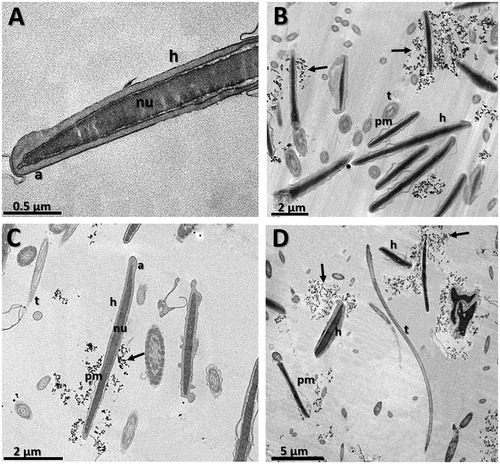
Figure 6. Transmission electron micrographies of bull spermatozoa after 4 h of incubation. (A) CO – control group, (B) G0.03: Group treated with MNP-DMSA at the concentration of 0.03 mg Fe/mL. Arrows indicate disruption in plasma membrane in both groups. pm: plasmatic membrane, a: acrosome, nu: nucleus.