
Figures & data
Figure 1. Model geometry of skin, adipose and muscle tissue layers. The thicknesses of the skin, ls, subcutaneous tissue, lf,c and muscle, lm, layers are, respectively, 1.5, 17 and 38 mm. δ is the parametric variable that represents the PCM thickness and is calculated or set constant as described in the text.
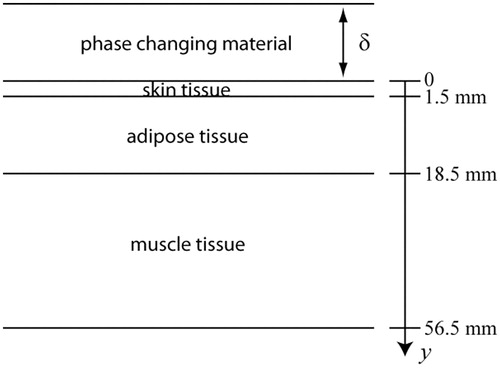
Table 1. Physical and perfusion properties of tissue layers, the density and specific heat of arterial blood are ρb = 927 kg/m3 and cb = 3600 J/kg·K, respectively [Citation4,Citation19,Citation20].
Table 2. Physical properties of the phase changing materials evaluated in this study [Citation6,Citation7,Citation21]; L is in [KJ/kg], ρ in [kg/m3], ks in [W/m·K] and c in [KJ/kg·K].
Figure 2. Phase-dependent specific heat of tissue and PCMs modelled as a piecewise function.
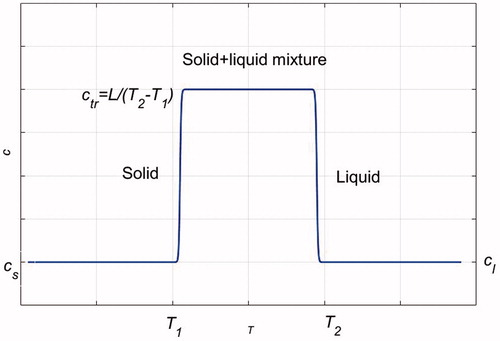
Figure 3. Temperature distribution across different layers of tissue when the skin surface temperature remains at −10 °C: — after 15 min of cooling, — after 30 min of cooling, – · – after 45 min of cooling, ··· after 60 min of cooling.
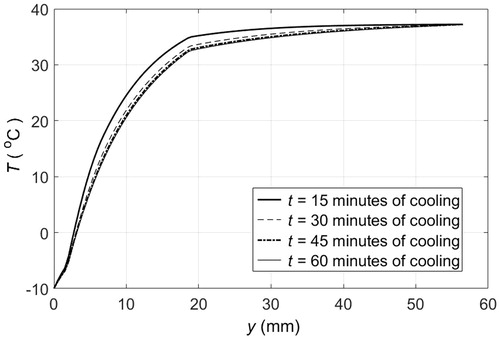
Figure 4. Heat flux at skin surface when the skin surface temperature remains at −10 °C.
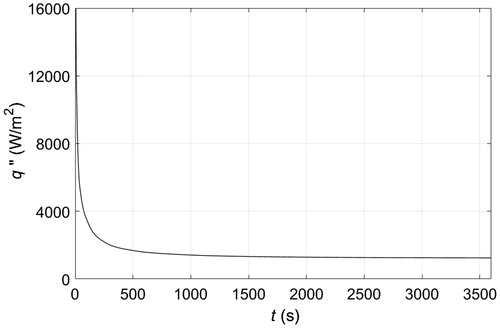
Figure 5. Thickness as a function of time required to maintain the surface temperature of the skin at −10 °C using PCM 10.
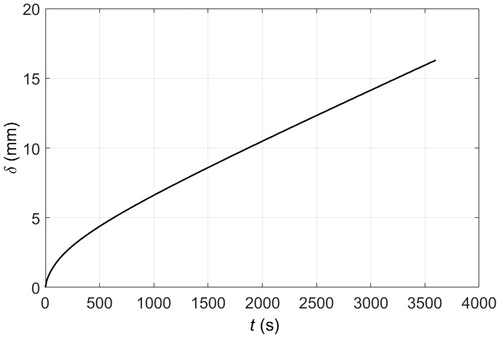
Figure 6. Temperature distribution across PCM pad and tissue layers when the skin surface is in contact with a 1 cm thick solid pad of PCM 10 initially at −10 °C: — after 15 min of cooling, – – after 30 min of cooling, – · – after 45 min of cooling, ··· after 60 min of cooling.
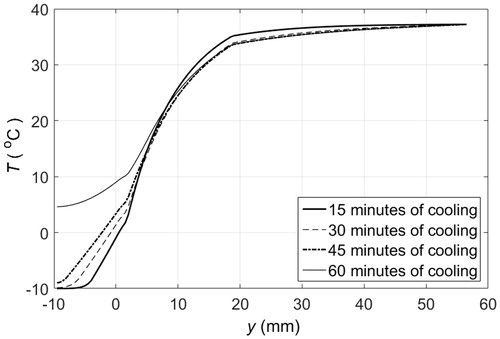
Figure 7. Temperature distribution across PCM pad and tissue layers when the skin surface is in contact with a 2 cm thick solid pad of PCM 10 initially at −10 °C: — after 15 min of cooling, – – after 30 min of cooling, – · – after 45 min of cooling, ··· after 60 min of cooling.
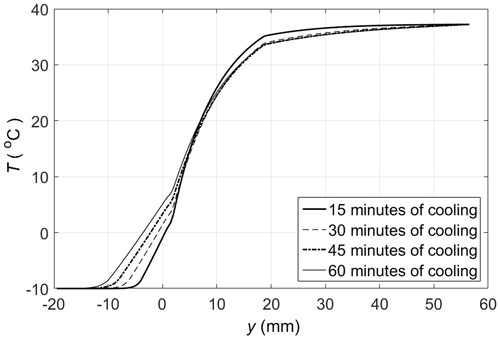
Figure 8. Temperature distribution of PCM pad and tissue layers when the skin surface is in contact with 1 cm thick solid pads of PCM 10, initially at −10 °C, that are replaced every 10 min. — after 15 min of cooling, – – after 30 min of cooling, – · – after 45 min of cooling, ··· after 60 min of cooling.
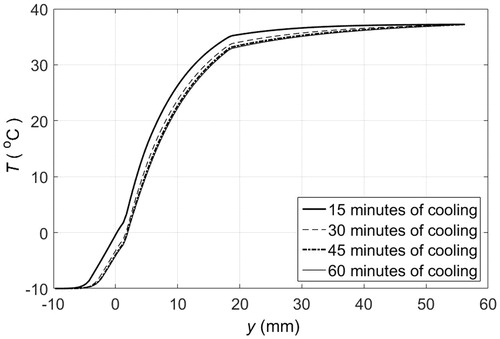
Figure 9. Heat flux at skin surface when cooled by 1 cm thick pads of PCM 10, initially at −10 °C, that are replaced every 15 min.
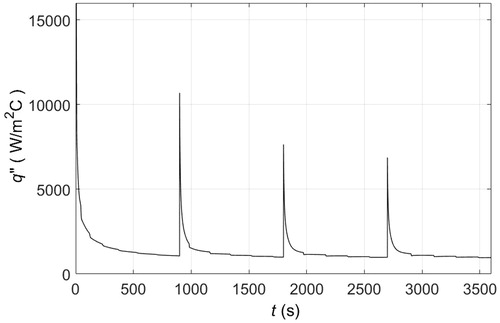
Figure 10. Temperature as a function of time at the skin-fat (—, y = 1.5 mm) and fat-muscle (– –, y = 18.5 m) interfaces: (a) skin surface is maintained at −10 °C; (b) skin cooled by 1 cm thick solid pads of PCM 1 originally at −22 °C; (c) skin cooled by 1 cm thick solid pads of PCM 5 originally at −15 °C; (d) skin cooled by 1 cm thick solid pads of PCM 8 originally at −22 °C; (e) skin cooled by 1 cm thick solid pads of PCM 9 originally at −26 °C; and (f) skin cooled by 1 cm thick solid pads of PCM 10 originally at −10 °C. PCM pads are replaced every 15 min.

Figure 11. (a) Experimental ice mass as a function of time during cooling of the abdomen of a volunteer. Control experiment refers to ice at room temperature placed on a thermally insulated surface. (b) Experimental and numerical ice mass as a function of time during cooling of the abdomen of a volunteer. Experimental measurements were averaged and adjusted as described in the Results section.
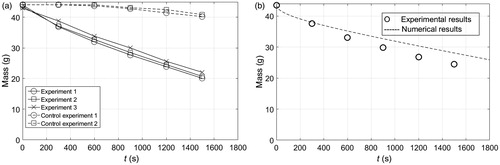
Figure 12. (a) Experimental and numerical temperature as a function of time and depth during cooling of a phantom with an ice block. Numerical results correspond to a three-dimensional simulation. (b) Analytical and numerical temperature as a function of time and depth during cooling of a phantom with an ice block. Numerical results correspond to a one-dimensional simulation.
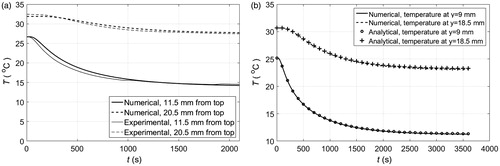
Figure 13. Location of the solid-liquid interface or displacement of the freezing front along the centre line of a slab filled with liquid. Time is scaled as τ = (2kst)/(ρscsx1). The agreement between our numerical solution and the one obtained in [Citation18] is good.
![Figure 13. Location of the solid-liquid interface or displacement of the freezing front along the centre line of a slab filled with liquid. Time is scaled as τ = (2kst)/(ρscsx1). The agreement between our numerical solution and the one obtained in [Citation18] is good.](/cms/asset/378beba1-64cc-41c4-bbe2-8d0942623db1/ihyt_a_1342872_f0013_b.jpg)