Figures & data
Figure 1. Graphical representation of points acquired for mental task isodecrement curves and calculated functions in these intervals.
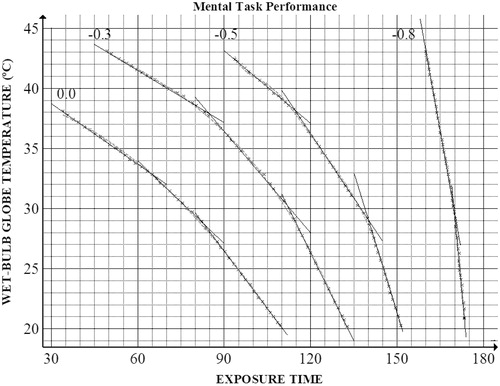
Table 1. Calculated functions for mental task isodecrement curves.
Table 2. Calculated straight segments representing 0.0, −0.3, −0.5 and −0.8 mental task isodecrement curves (from top to bottom: Line 1 to Line 3).
Figure 2. Graphical representation of points acquired for tracking performance isodecrement curves and calculated functions.
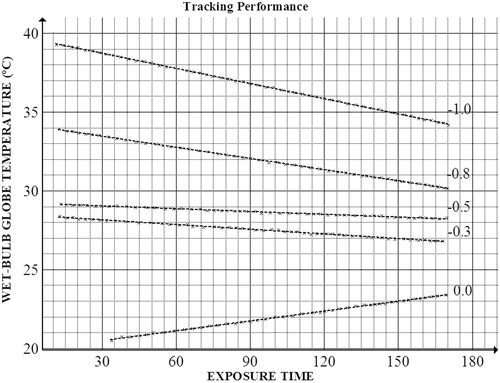
Figure 3. Graphical representation of points acquired for reaction time isodecrement curves and calculated functions.
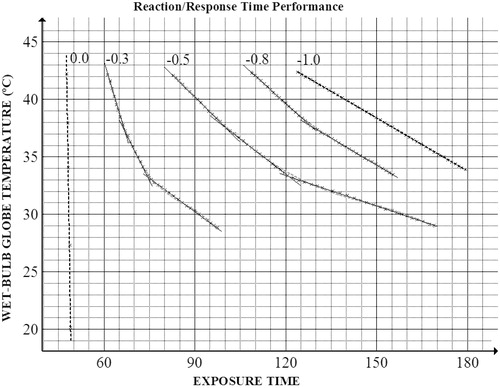
Figure 4. Graphical representation of points acquired for vigilance tasks isodecrement curves and calculated functions.
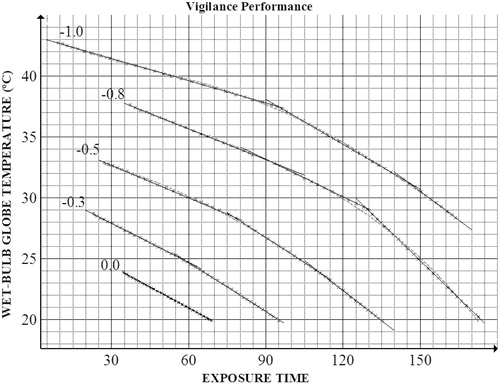
Figure 5. Graphical representation of points acquired for complex task performance isodecrement curves and calculated functions.
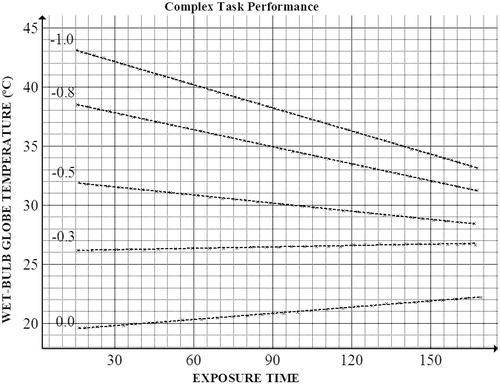
Figure 6. Graphical representation of points acquired for conjoint mental and reaction time isodecrement curves and calculated functions.
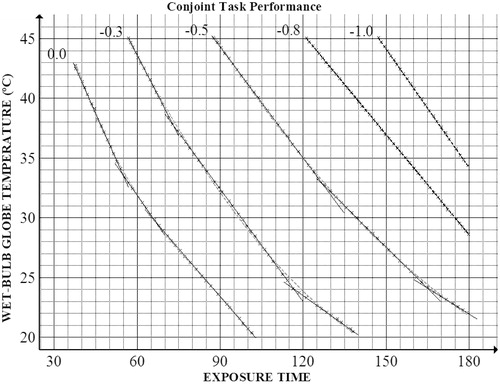
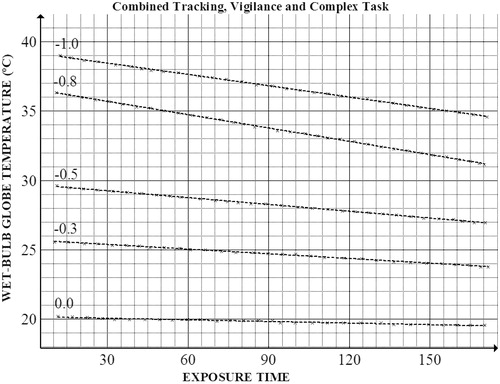
Figure 7. Graphical representation of points acquired for combined tracking, vigilance and complex tasks performance isodecrement curves and calculated functions.