Figures & data
Figure 1. Biofilm architectural differences due to growth method. Confocal fluorescent microscopy images of biofilms grown in (A) on a shaker table for 72 h; and (B) a drip flow reactor where the media is applied and drained dropwise for 20 h following 4 h of static incubation. Both biofilms use the same strain of P. aeruginosa and the same tryptic soy broth supply. 3-D images at 1 μm depth increments are overlaid to form these figures.
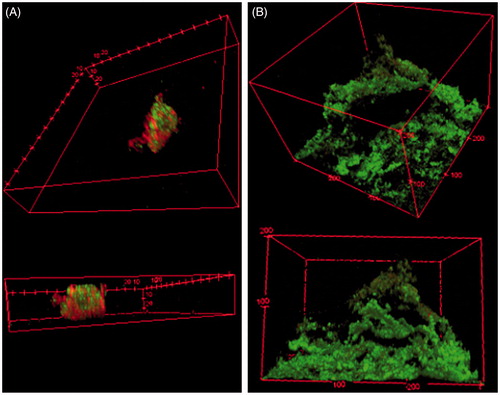
Figure 2. Effect of growth method on thermal susceptibility. Surviving CFU/cm2 following thermal shock is compared for biofilms grown on a shaker table vs. grown in a drip flow reactor. All trials used the same tryptic soy broth supply, incubation conditions, and thermal shock protocols, with trials at 37, 50, 60 and 80 °C for 1, 5 or 30 min as indicated. The asterisk indicates values that are statistically different (p < 0.05) from their corresponding control thermal shock at 37 °C.
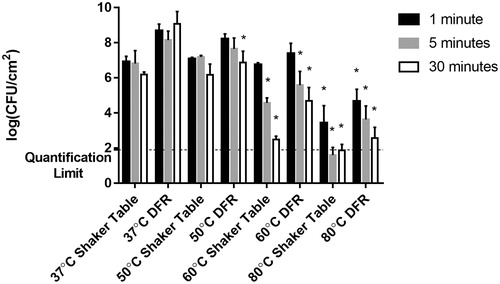
Figure 3. Effect of growth media on biofilm population density. Bacterial biofilm population densities are shown for shaker table-grown biofilms cultured in four different media types. In these control trials, all “thermal shocks” were performed at the incubation temperature of 37 °C (i.e. no shock) for the indicated exposure time: 1, 5 or 30 min.
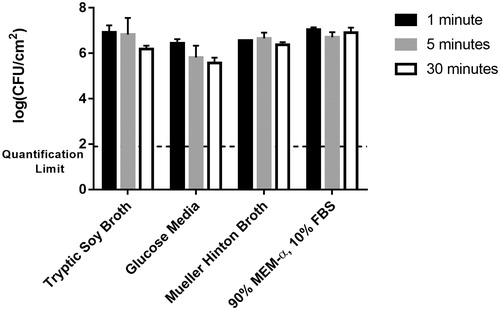
Figure 4. Thermal susceptibility of shaker table-grown biofilms. At 50 °C, no population decrease is observed regardless of exposure time, while at 60 °C the population drops sharply with time. At 80 °C the decrease is typically too large to be quantified at exposure times of 5 min and 30 min, unlike the exposure time of 1 min.
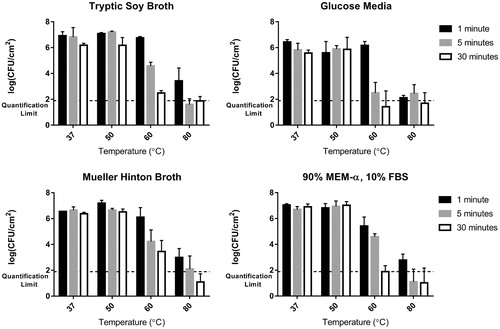
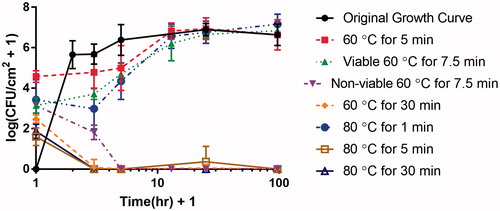
Figure 5. Biofilm regrowth post-thermal shock. Shaker plate-grown biofilms in TSB were thermally shocked and then re-incubated before enumeration to determine their regrowth rate. The horizontal axis indicates the hours after thermal shock (plus 1 h in order to plot the data on a logarithmic scale). The original growth curve (time after inoculation, not heat shock) is included (black circles) for comparison. Note there are two lines for regrowth after a thermal shock at 60 °C for 7.5 min since three quarters of the biofilms died out while the other quarter regrew. Additionally, thermal shocks of 60 °C for 30 min, 80 °C for 5 min, and 80 °C for 30 min had little to no regrowth while the other thermal shocks resulted in fully recovered biofilms post-heat shock.