
Figures & data
Figure 1. Patient survival by underlying disease.
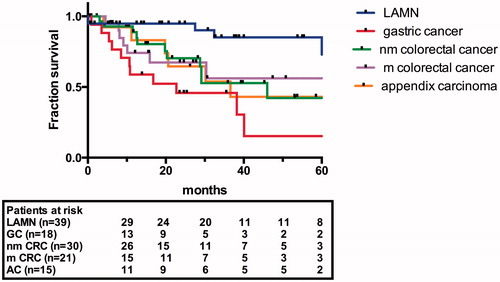
Table 1. Patient demographics from mucinous and non-mucinous peritoneal malignancies.
Table 2. Operation and postoperative course demographics from mucinous and non-mucinous peritoneal malignancies.
Table 3. Cox regression model for patient’s death.
Figure 2. Patient survival comparing patients with PCI <16 and PCI ≥16; a: patients with non-mucinous PSM; b: patients with mucinous PSM.
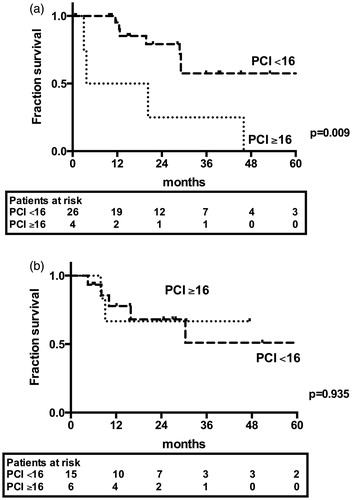
Table 4. Patient demographics from non-mucinous colorectal cancer.
Table 5. Patient demographics from mucinous colorectal cancer.