
Figures & data
Table 1. The inclusion and exclusion criteria.
Table 2. The patient characteristics and treatments.
Figure 1. The thermal parameters (CEM43T90, median T25, median T90 and median T50) in each of the HT treatment sessions.
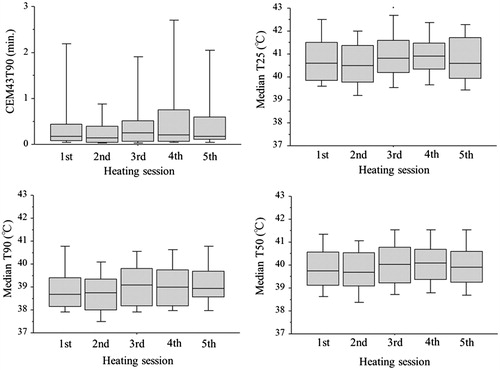
Figure 2. (a) The LRFS for the 26 cases with CEM43T90 ≥ 1 min was significantly better than LRFS for the 21 cases with CEM43T90 < 1 min (p = 0.024) and the 50 CRT alone cases (p = 0.036). The CEM43T90 < 1 min cases had LRFS indistinguishable from the CRT alone cases (p = 0.80). At five years the LRFS for the CEM43T90 ≥ 1 min, CEM43T90 < 1 min, and CRT alone cases were 92%, 65%, and 71% respectively. (b) The DFS for the cases with CEM43T90 ≥ 1 min was significantly better than DFS for the CRT alone cases (p = 0.036), but did not achieve statistical significance when compared with the CEM43T90 < 1 min cases (p = 0.071). The CEM43T90 < 1 min cases had DFS indistinguishable from the CRT alone cases (p = 0.89). At five years the DFS for the CEM43T90 ≥ 1 min, CEM43T90 < 1 min, and CRT alone cases were 81%, 60%, and 61% respectively.
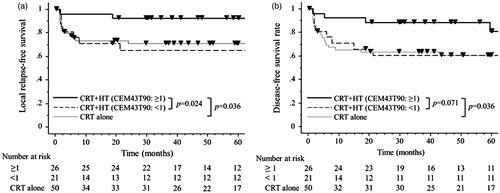
Table 3. The factors predicting survival in the 47 patients treated with definitive CRT plus regional HT.
Figure 3. The CR rate tended to be correlated with the CEM43T90 value (p = 0.056). The error bars show the standard error.
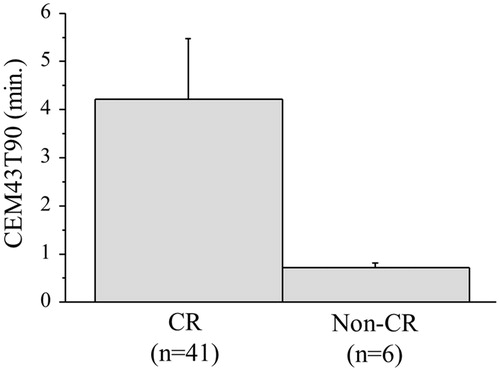
Table 4. Acute-phase toxicities between the CRT + HT with CEM43T90 (≥1) and CRT + HT with CEM43T90 (<1).