
Figures & data
Figure 1. Work rate protocol for exercise testing for the three different ambient temperatures. Gray horizontal bars indicate time periods for mean value calculations during rest (30 s), at low and high constant phases (30 s), during the PRBS phases (300 s) and at the end of the WR steps of 100, 125 and 150 W (30 s each). PRBS: pseudorandom binary sequence.
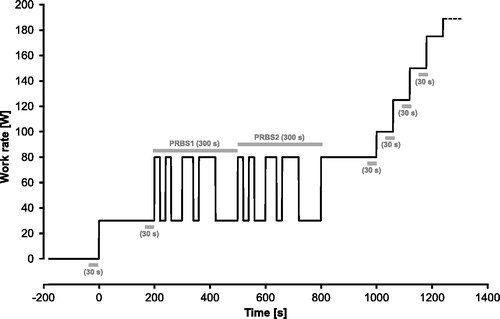
Table 1. Ambient conditions in the climatic chamber during the exercise tests (mean ± SD).
Figure 2. Test procedure time line. See text for details.
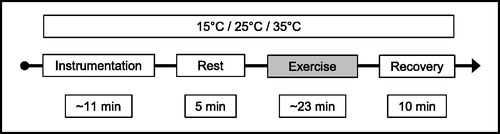
Table 2. Peak responses (mean ± SD) during exercise for 15 °C, 25 °C and 35 °C ambient temperatures.
Figure 3. (a,b) Absolute values of HR (mean ± SE, 3a) and CBT (mean ± SE, 3b) as function of WR across the ambient temperatures (15 °C, 25 °C and 35 °C). CBT: core body temperature; HR: heart rate; SE: standard error of the mean; WR: work rate.
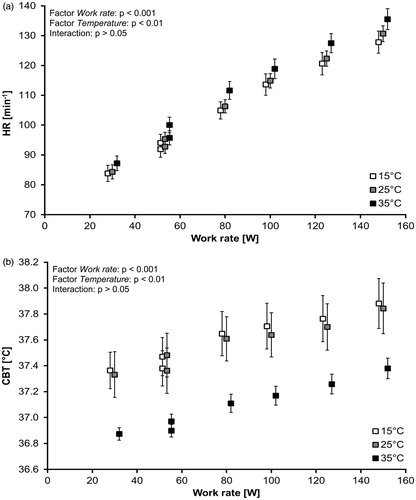
Figure 4. (a–c) Relative changes of HR (ΔHR, mean ± SE, 4a), CBT (ΔCBT; mean ± SE, 4b) and PSI (mean ± SE, 4c) based on the resting values as function of work rate across the ambient temperatures. CBT: core body temperature; HR: heart rate; PSI: physiological strain index; SE: standard error of the mean.
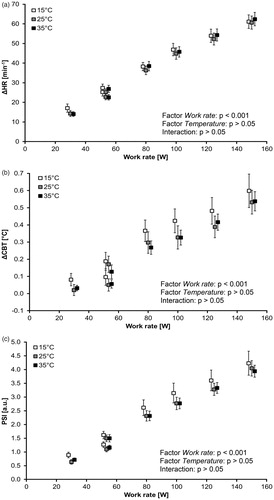
Figure 5. (a–c) Means (±SE) of the cross-correlation functions (CCF) of WR with HR (5a), pulmonary (V̇O2pulm 5 b) and muscular (V̇O2musc, 5c) oxygen uptake, respectively, for the different ambient temperatures. The grey triangle displays the ACF of WR. The upper right enhanced graphs display the mean values (± SE) at specific lag times (−20, −10, 0, 10, 20, 30, 40, 50, 60, 70, 80, 90, 100, 110 and 120 s) for a comparison applying a two-way ANOVA with factors Lag and Posture. Significant differences for factor Lag are not displayed graphically to avoid overloading the figure. See text for further explanation. ACF: auto-correlation function; ANOVA: analysis of variance; HR: heart rate; SE: standard error of the mean; WR: work rate.
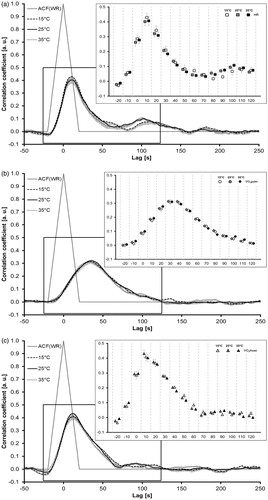
Figure 6. Mean (±SE) of the CCF [maxima and lags (CCFmax, CCFlag)] of work rate with HR, pulmonary (V̇O2pulm) and muscular (V̇O2musc) oxygen uptake, respectively, for 15 °C, 25 °C and 35 °C ambient temperatures. The grey line illustrates the auto-correlation function of WR (in part). Data points that are close to or on this line represent therefore possible assumptions of a linear first-order response of the physiological system or parameter behind the computational rational. CCF: cross-correlation function; HR: heart rate; SE: standard error of the mean.
![Figure 6. Mean (±SE) of the CCF [maxima and lags (CCFmax, CCFlag)] of work rate with HR, pulmonary (V̇O2pulm) and muscular (V̇O2musc) oxygen uptake, respectively, for 15 °C, 25 °C and 35 °C ambient temperatures. The grey line illustrates the auto-correlation function of WR (in part). Data points that are close to or on this line represent therefore possible assumptions of a linear first-order response of the physiological system or parameter behind the computational rational. CCF: cross-correlation function; HR: heart rate; SE: standard error of the mean.](/cms/asset/077be2e3-71d0-44cc-9c34-a769d3350acf/ihyt_a_1354402_f0006_b.jpg)
Table 3. Means and SD of model parameter estimates and time-series analysis between HR, muscular (V̇O2musc) and pulmonary (V̇O2pulm) oxygen uptake for 15 °C, 25 °C and 35 °C ambient temperatures.


Figure 8. SDS of HR, muscular (V̇O2musc) and pulmonary oxygen uptake kinetics [V̇O2pulm, without and with lag-correction (+20 s)]. The deviance is calculated between simulated CCF courses derived from the corresponding CCFmax value and the measured or estimated parameter (from lags −20 to 180 s, see ). Smaller values indicate better agreements with first-order system properties. CCF: cross-correlation function; HR: heart rate; SDS: sum of deviation squares.
![Figure 8. SDS of HR, muscular (V̇O2musc) and pulmonary oxygen uptake kinetics [V̇O2pulm, without and with lag-correction (+20 s)]. The deviance is calculated between simulated CCF courses derived from the corresponding CCFmax value and the measured or estimated parameter (from lags −20 to 180 s, see Figure 7). Smaller values indicate better agreements with first-order system properties. CCF: cross-correlation function; HR: heart rate; SDS: sum of deviation squares.](/cms/asset/3f0877ea-1169-4a47-8f7c-435ccf3fd654/ihyt_a_1354402_f0008_b.jpg)