Figures & data
Figure 1. Comparison of the spectra of the iron standards (0–2 μg Fe+3) in working solution. Ferene-s (A), ferrozine (B), and the corresponding standard curves (0.1–4 μg Fe+3) measured at the peak absorbance for each compound (560 nm for ferrozine and 595 nm for ferene-s), (C).
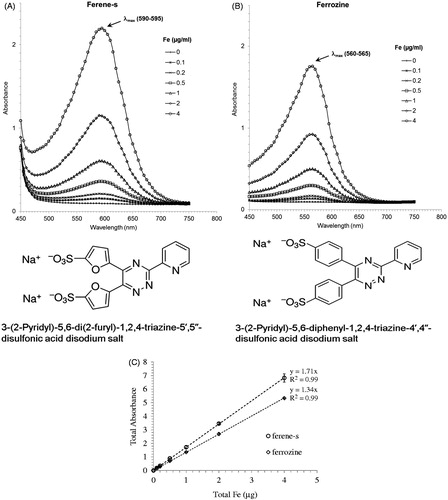
Table 1. Iron concentrations obtained from various iron oxide nanoparticles.
Figure 2. Time course of absorbance at 595 nm for ferene-s assay in working solution. Iron oxide nanoparticles with various formulations (A) and intracellular BNF-Starch iron oxide nanoparticles (B), DU145 cells with low, medium and high Fe content). Absorbance readings are adjusted to reflect equivalent number of cells.
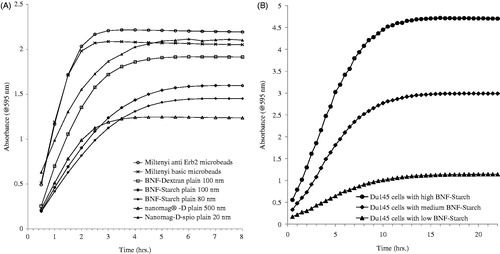
Figure 3. Digestion with concentrated nitric acid. Intracellular BNF-Starch iron oxide nanoparticles digested at various times at 70 °C prior to addition to the working solution.
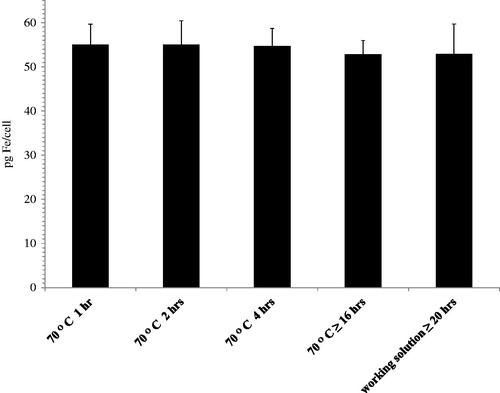
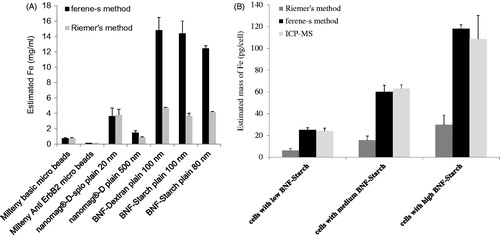
Figure 4. Comparison with Riemer’s method. Iron oxide nanoparticles with various formulations (A) and intracellular BNF-Starch iron oxide nanoparticles (B). Identical samples for each formulation of nanoparticles or DU145 cells loaded with BNF-Starch were prepared in duplicates.