Figures & data
Figure 1. Mean actual and estimated TNF-α leakage. Top panel illustrates (log scale) the fluctuation in systemic/circuit TNF-α ratio; note how this value is inconspicuous in “low” leakers. In the bottom panel is depicted the radioisotope estimation of circuit-to-systemic leakage.
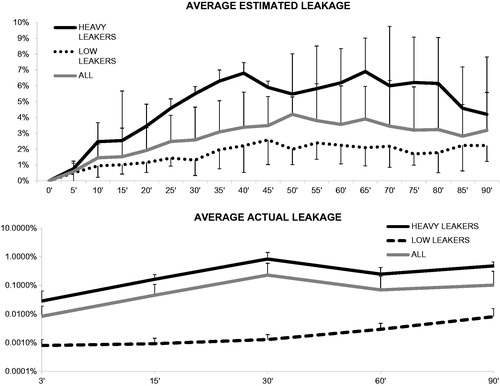
Figure 2. Circuit and systemic TNF-α levels. Mean circuit levels (top panel) tended to progressively decrease during the ILuP procedure, as the drug was delivered to the target tissue. Systemic levels (depicted in a logarithmic scale) showed a differential behaviour in “heavy” and “low” leakers: in the former, corrective interventions could counter the initial drug shunt, while in the latter, the levels were consistently low throughout the procedure.
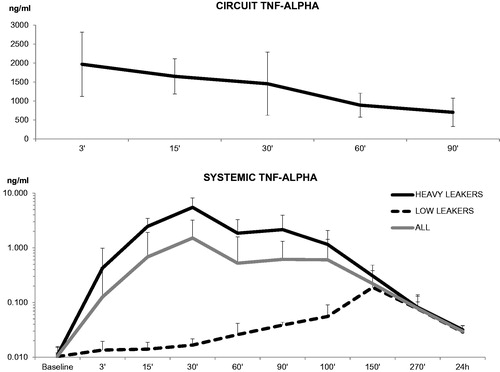
Figure 3. Correlation between actual and estimated leakage. A significant correlation was detected when considering either all of the patients (top panel), “heavy” leakers (middle panel), or low leakers (bottom panel).
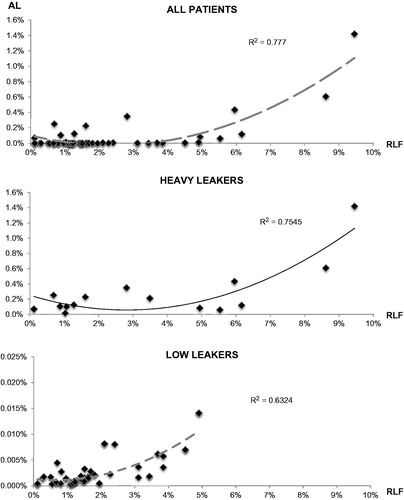
Table 1. Actual and estimated leakage in Heavy leakers (HL) and Low leakers (LL).
Figure 4. Role of pleural shunt. The definite integral of TNF-α levels within the circuit is mirrored by the quantity of cytokine found in the aspirate (upper panel). However, it is the efficiency of TNF-α removal from the cavity that determines the success of leakage prevention: patients with high levels of removed cytokine (middle panel) or with a smaller difference between the circuit and pleural aspirate TNF-α (bottom panel) have correspondingly lower RLF. Black dots represent “heavy leakers”.

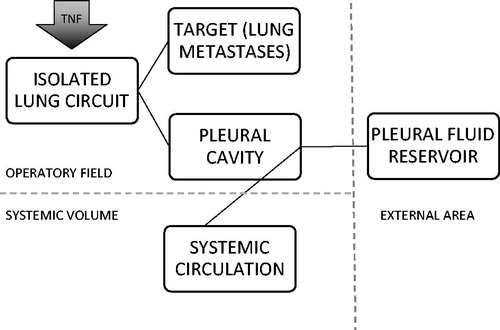
Figure 5. Metabolic destinies of TNF-α. After injection into the isolated circuit, the cytokines can be distributed to the lung and to the lung metastases or they can leak into the pleural cavity. Thereby, they can be removed by the operator by aspiration or can be reabsorbed by the pleural venous and lymphatic circulation.