
Figures & data
Table 1. Patients’ data for the different systems used.
Figure 1. T1 weighted MRI of a 69-year-old woman showing metastasis of a primary breast carcinoma in liver segment 8 (arrow) measuring 14.1 mm prior to microwave ablation (a). After microwave ablation with ECSEC for 10 min with a cumulative output energy of 52,800 J, an almost ideal spherical ablation zone (deviation from 1.0 for ideal sphericity was 0.065) was detected 24 h post ablation in consecutive T1 weighted unenhanced transverse (b,c) and sagittal (d,e) MR images. Two consecutive slices per plane are shown for a better demonstration of the spherical ablation zone.
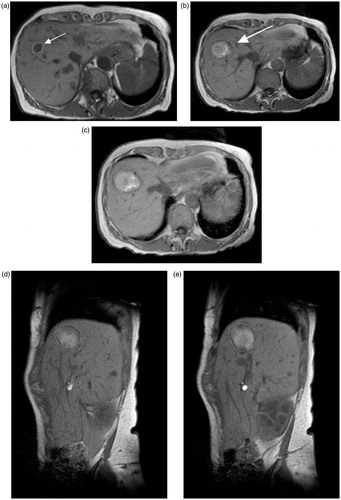
Figure 2. Various ablation zones representing the differences in this study (ECSEC: a–d; HF-MWA: e–h; LF-MWA: i–l). (a) Pre-ablation MR image of the 69-year-old woman from Figure 1 with metastasis of a primary breast carcinoma who underwent microwave ablation ECSEC. T1-weighted axial MR images obtained after 24 h (b) and three months (c) and the CT image after six months (d) show a constant spherical morphology of the ablation zone. (e) The axial T1-weighted MR image shows focal inhomogeneities at a known primary CCC in a 77-year-old woman before thermal MWA therapy. After treatment with HF-MWA, the character of a “tear-drop’’-shaped ablation zone could be detected in the MR follow-up studies after 24 h (f), three months (g) and six months (h). The deviation from the target for the complete ablation zone in this case was 0.374. The third case (i–l) shows a T1-weighted unenhanced MRI of a 43-year-old woman with metastasis of primary renal cell carcinoma in liver segment two measuring 11.3 mm (i). The oval-shaped ablation zone 24 h after microwave treatment with LF-MWA had a diameter measuring 16.3 × 43.3 mm (j). Follow-up studies (k, l) confirmed the oval shape of the ablation zone after three and six months. In each case, technical success and efficacy were achieved, but the minimal ablative margin was larger with ECSEC (trans/sag: b: 10/8.3 mm versus. f: 3.9/5.1 mm versus. j: 4.3/2 mm).
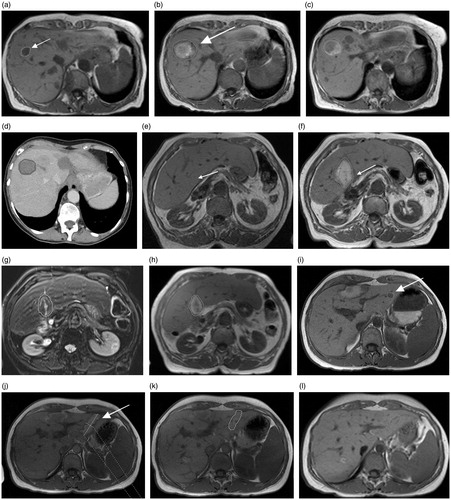
Figure 3. Box plots showing the mean, median, SD and quartiles for the minimal ablative margin per ablation zone (a) and for deviation from 1.0 of the diameter ratios (b) after therapy with different MWA technologies.
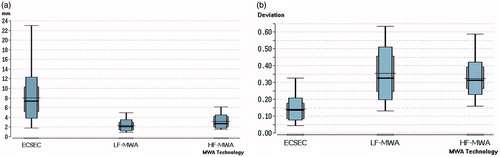
Table 2. Minimal ablative margin.