Figures & data
Table 1. Experimental parameters of the experiments conducted.
Figure 1. Schematic of the measured end points, i.e. cube’s dimensions and/or extent of the ablated and carbonised regions, as well as the derived dimensions, i.e. the resulting shrinkage.
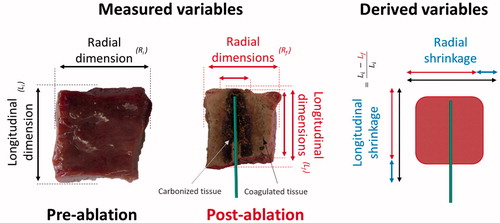
Figure 2. Percent tissue shrinkage obtained from microwave ablation as a function of time for different cubes’ size and devices: mean, maximum, and minimum values are reported. From top to bottom: Acculis™ MTA System AngioDynamics (MS), Amica™ system HS Hospital Service SpA (HS), and Emprint™ Covidien (CV). Left: radial; right: longitudinal.
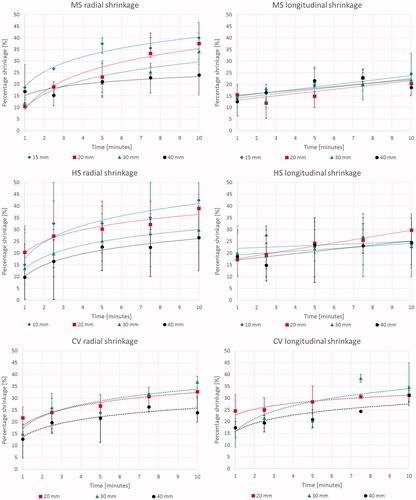
Table 2. Correlation of tissue shrinkage as a function of time for various cubes and devices. Correlations are presented as average values with standard deviation and statistical significance reported.
Figure 3. Absolute dimensions of carbonised tissue at the end of the ablation procedure as a function of time for different cubes’ size and device: mean, maximum, and minimum values are reported. From top to bottom: Acculis™ MTA System AngioDynamics (MS), Amica™ system HS Hospital Service SpA (HS), and Emprint™ Covidien (CV). Left: radial; right: longitudinal.
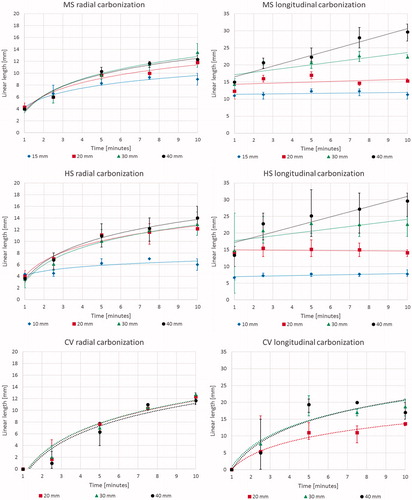
Table 3. Correlation of central tissue carbonisation extension as a function of time for different cubes and devices. Correlations are presented as average values with standard deviation and statistical significance reported.
Figure 4. Percent shrinkage (left) and absolute dimensions (right) of the carbonised area as a function of the time for 30 mm side cubes with direct comparison of the different devices: mean, maximum, and minimum values are reported. Top: radial; bottom: longitudinal.
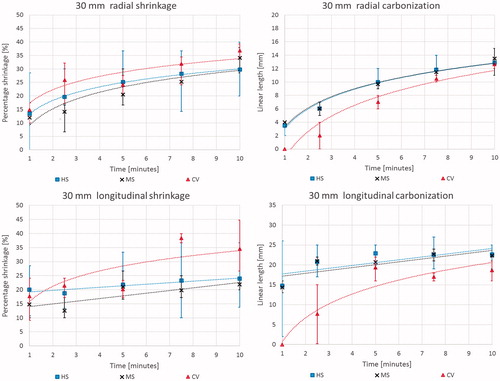
Table 4. Quantitative data of tissue shrinkage, carbonisation, and extension of the ablated area. These are reported as absolute and as percentage of the ablated area for samples treated for 5 and 10 min.
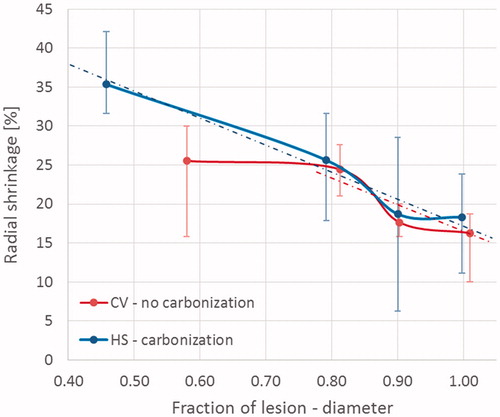
Figure 5. Percent shrinkage in the presence of carbonisation. Results are presented as a function of the radial distance from the antenna axis normalised to the ablated area. Different cube sizes (20, 30, and 40 mm) and ablation times (5, 7.5 and 10 min) are considered. The different devices are indicated by various shaped markers (Amica™ system – HS: squares; Acculis™ system – MS: crosses; Emprint™ system – CV: triangles). The grey edge denotes the maximum carbonisation obtained from all the considered experiments (i.e. 20 mm at 10 min).
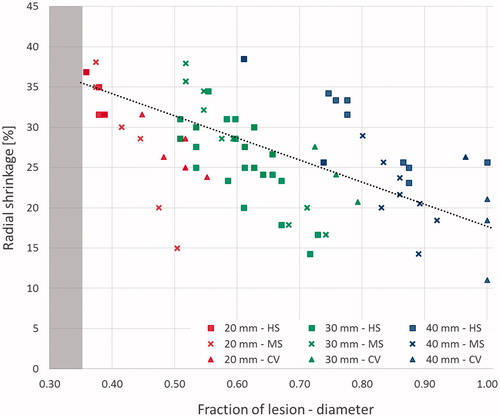
Figure 6. Percent shrinkage in the presence (Amica™ system – HS: blue) or absence (Emprint™ system – CV: red) of carbonisation. Results are presented as a function of the radial distance from the antenna axis normalised to the ablated area. Samples were ablated for 1 and 2.5 min.