Figures & data
Figure 1. Uncertainty weighted and unweighted fits using the AlphaR (left) and LQ-model (right) of HCT116 cell survival data at 48 °C as a function of heating time. Whereas there is no big difference between the two fits for the AlphaR model fit, the curves of the LQ model show a more obvious influence of the weighting. The respective coefficients of determination are very similar: R2AlphaR Weighted = 0.997, R2AlphaR Unweighted=0.996, R2LQ Weighted = 0.991, R2LQ Unweighted = 0.988.
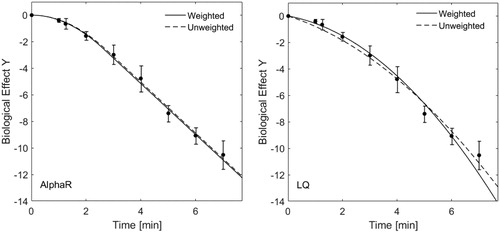
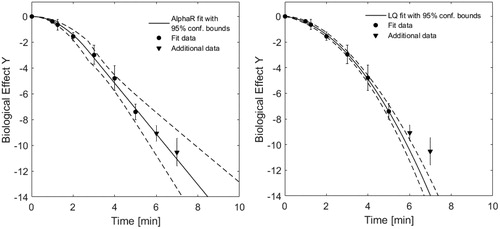
Figure 2. Uncertainty weighted fits using the AlphaR (left) and LQ-model (right) of HCT116 cell survival data at 48 °C as a function of heating time. The fit curves obtained with 95% confidence bounds (dashed lines) when fitting the data up to heating times of 5 min (round points) are shown. Fit curves were then extrapolated to longer heating times, and compared to additional experimental data (triangles) at 6 and 7 min. Whereas both models provide a good fit within the range of data included for fitting, the exponentially linear arm of the AlphaR model also provides a good fit in the extrapolated region (R2AlphaRAllData=0.995), whereas the continuously bent LQ-model would underestimate survival at higher heating times (R2LQAllData = 0.892).