
Figures & data
Table 1. Patients characteristics.
Figure 1. Axial CT images of a 71-year-old man with a 2.2-cm metastatic tumour in right lung from primary colorectal cancer. (A) Image obtained immediately before MWA, (B) image obtained during MWA, (C) image obtained 3 months after ablation, (D) image obtained 1 year after MWA and (E) image obtained 3 years after MWA.
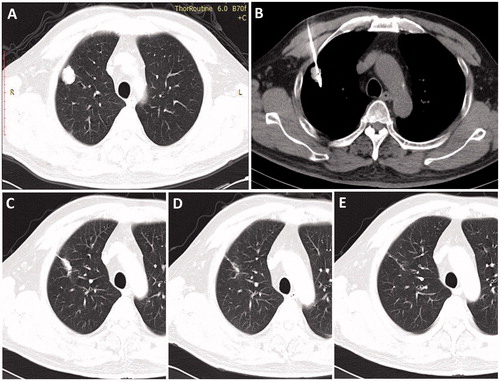
Table 2. Complications of percutaneous microwave ablations (48 sessions).
Figure 2. Kaplan–Meier estimates of the overall survival (OS) for 32 patients. The median survival time was 31 months (95% CI: 15.4–46.6).
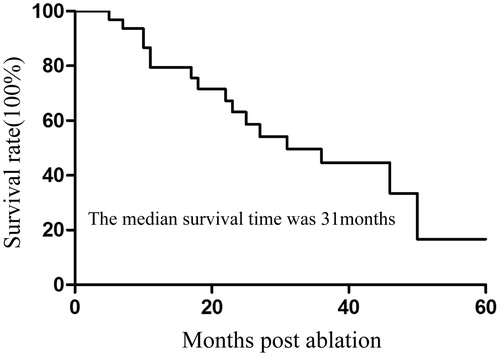
Figure 3. Kaplan–Meier estimates of the overall survival (OS) for 32 patients divided into two subgroups according to tumour size (p = .007). Continuous line: patients with tumour ≤3 cm; dotted line, patients with tumour >3 cm.
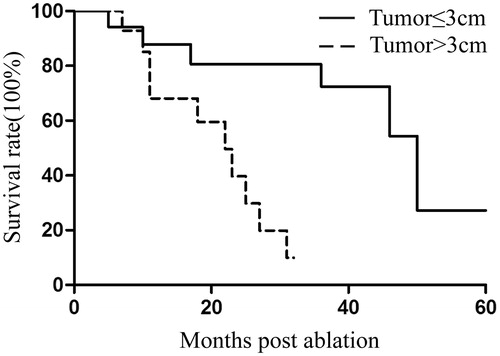
Figure 4. Kaplan–Meier estimates of the overall survival (OS) for 32 patients divided into two subgroups according to DFI (p = .022). Continuous line: patients with DFI >12 months; dotted line, patients with DFI ≤12 months.
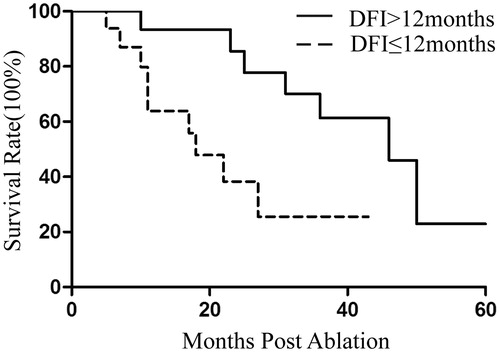
Figure 5. Kaplan–Meier estimates of the overall survival (OS) for 32 patients divided into two subgroups according to tumour number (p = .030). Continuous line: patients with one lesion; dotted line, patients with >1 lesions.
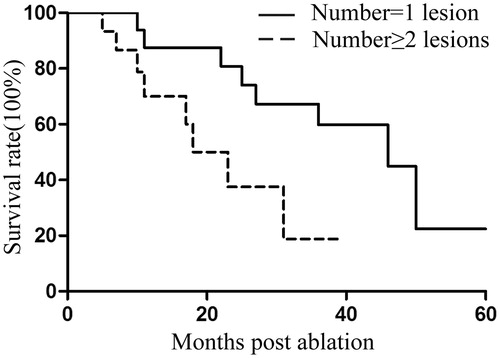
Table 3. Univariate and multivariate analyses of overall survival in patients.