
Figures & data
Figure 1. Low-dose CT protocols for guiding RFA in a 34-year-old man. (A) Contrast-enhanced axial CT image in the planning phase shows the location, size and number of RCC (white solid arrow) before lesion targeting. A white blank arrow indicates a grid for localising a tumour. (B) Unenhanced axial CT image in the targeting phase shows the direction and location of an electrode (black arrow) that is placed within the tumour. (C) Unenhanced axial CT image for monitoring phase shows the ablation area (arrowheads). No complication occurred following each ablation cycle. A black arrow indicates an electrode. (D) Unenhanced axial CT image for survey phase shows that the tumour size (white solid arrow) and tumour margin (arrowheads) are markedly shrunken. Overall CT image quality shown in (A–D) is not good but acceptable for RFA procedures. (E) Contrast-enhanced axial CT image, which is obtained 51 months after RFA, shows no local tumour progression but a post-ablation scar tissue (white solid arrow).
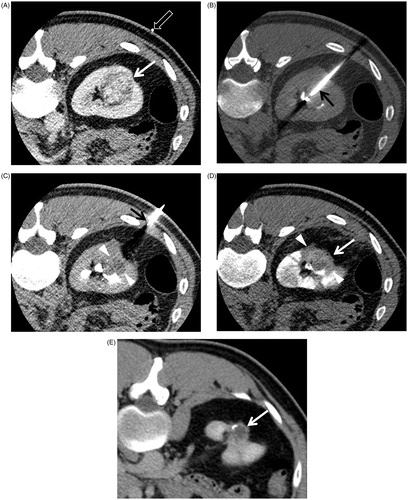
Figure 2. A photograph of the Proteus RF Electrode. The length of noninsulated electrode (arrowhead) is controlled from 0.5 to 3 cm in the handle (arrow).
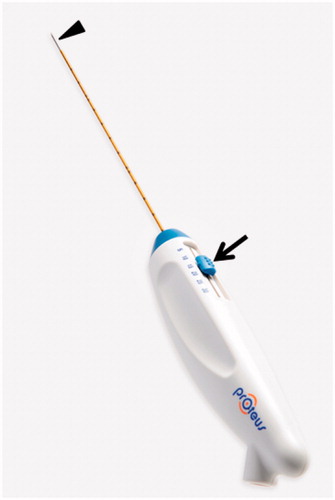
Table 1. CTDIvol, DLP and effective dose of each RFA phase per session.
Table 2. CT parameters of RFA phases.
Table 3. Subset analysis in terms of RCC size and location.