Figures & data
Figure 1. HIFU treatment planning showing the two circumferential treatment rings (black) and the deselected centre of the fibroadenoma (grey).
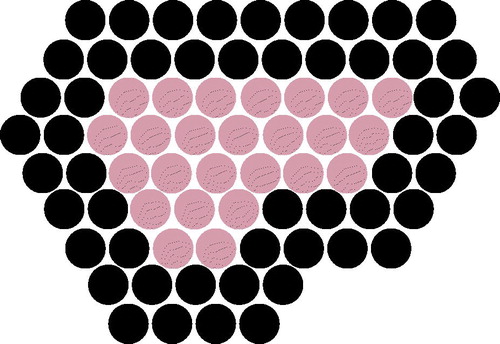
Table 1. (a) Patient and (b) HIFU treatment characteristics (SD: standard deviation).
Figure 2. Change in fibroadenomata volume on ultrasound over time by patient (n) in percentage reduction.
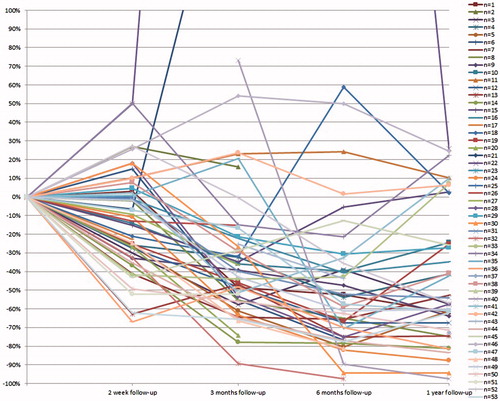
Figure 3. Ultrasound images of three patients showing change in volume over time; pre-treatment (a–c), 2 weeks (d–f), 3 months (g–i), 6 months (j–l) and 12 months (m–o) follow-up.
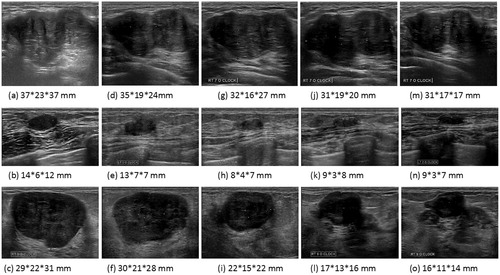
Figure 4. Boxplot of the logarithm of the fibroadenoma volume as seen on ultrasound at each follow-up moment (1: pre-treatment, 2: 2 weeks, 3: 3 months, 4: 6 months and 5: 12 months follow-up, °: outliers).
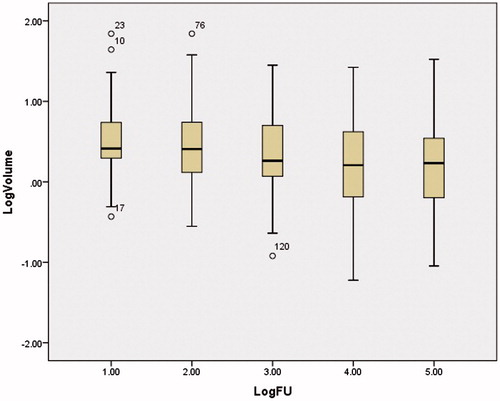
Figure 5. Ultrasound images (pre-treatment – 22*12*12 mm, 2 week follow-up – 19*8*10 mm and 3 months follow-up – 19*8*10 mm) showing no change in volume and histopathology outcome of a patient who underwent surgical excision 3 months after HIFU treatment, showing fat necrosis and fibrosis.
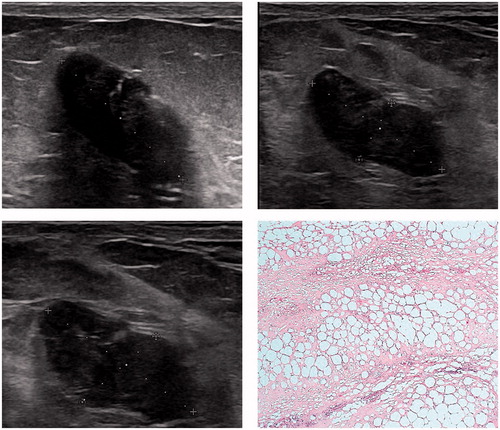
Table 2. Fibroadenomata volumes over time measured with ultrasound (mean (standard deviation)).
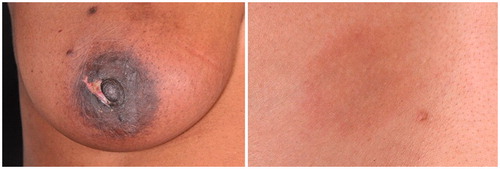
Figure 6. Complications recorded during the study (l) skin burn at 2 weeks and (r) hyperpigmentation at 3 months.