Figures & data
Figure 1. The breast scanning transmission ultrasonic system. (a) A general outline of the system, comprising of a water tank, a motorised unit connected to two ultrasonic transducers and a top cover into which the breast is inserted through a hole. (b) Data acquisition modes used in this study. The straight horizontal and vertical arrows (green) describe the transducers motion during the acoustic projection raster imaging acquisition. The round (blue) arrow describes the rotation of the transducers axis, applied during the UCT mode.
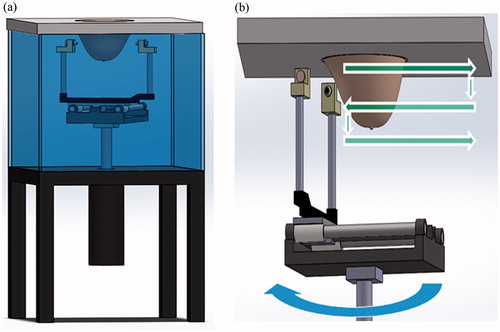
Figure 2. The setup used for the NPs hyperthermia acceleration experiments. (a) Experimental setup used for CuO NPs setup, evaluating temperature changes as well as UCT enhancement. A stirrer was used to insure solution homogeneity, which contained consecutively increased concentration of CuO in water. A MW antenna applicator was activated while a temperature sensor provided reference measurements. (b) Two polypropylene tubes were filled with 5 ml of distilled water (left) and 5 ml of 404 µg/ml IO NPs (right). A MW antenna applicator was located 10.85 mm equidistance from each tube centre, in which a temperature sensor was fixed. The dashed rectangle marks the FOV for the acoustic projection images, acquired while heating.
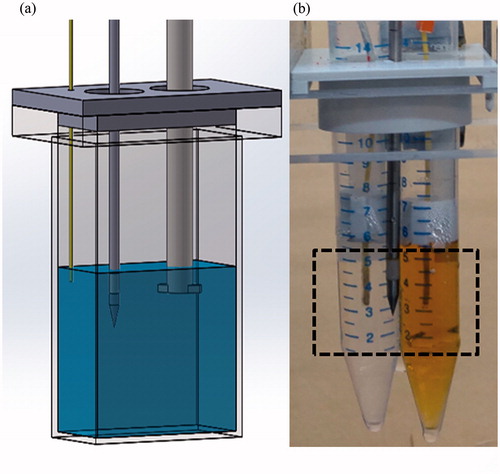
Figure 3. Heterogeneous ex vivo breast imaging phantom, composed of poultry fat, poultry skin, agar and two 8 mm polyolefin embedded targets, containing water and NPs.
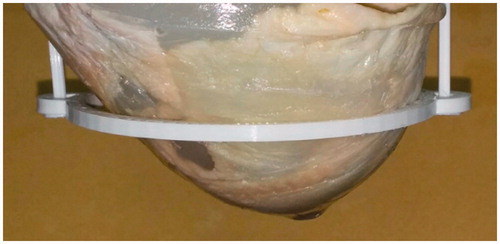
Figure 4. Thermometric transmission ultrasound imaging of an in vitro setup composed of two test tubes, each containing a temperature sensor and a MW antenna in water. (a) The measured temperature change at the two tubes during the 5 W heating of the right tube. (b) Corresponding six ΔTOF images obtained during the heating. The numbers above each sub-image represent the temperature difference with respect to the baseline at the middle of the scan. Notice the consistent TOF shortening trend. (c) The measured temperature change at the two tubes during the 60 W heating of the right tube. (d) Corresponding six ΔTOF images obtained during the heating. Note the larger scaling on the colour-bar compared to (b), depiction of the much more pronounced ΔTOF, as expected.
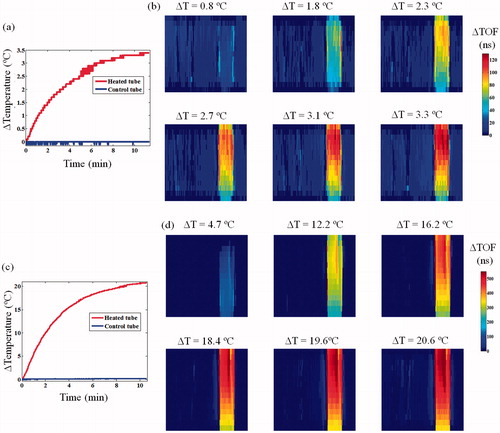
Figure 5. Ex vivo poultry breast hyperthermia experiment. (a) Baseline acoustic projection image of the specimen prior to MW irradiation. (b) The measured temperature during the experiment. The MW energy was increased from 0 to 130 W using four levels. (c) A gross pathology section of the specimen following the experiment, note the white region at the top, corresponding to the heated zone. (d) ΔTOF acoustic projection images depicting the temperature change throughout the experiment. Note the gradual increase in the ΔTOF, corresponding to the temperature rise in the heated region.
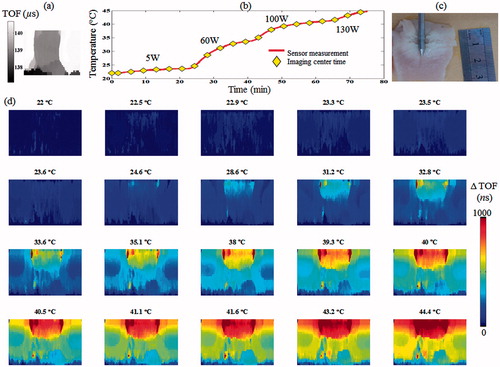
Figure 6. IO NPs hyperthermia acceleration phenomenon. The test tubes setup depicted in was heated using 100 W power. The right tube contained rising concentrations of IO NPs, whereas the left tube contained water, and served as a control. Each of the three presented Δheat-rate curves represents the subtraction of the temperature vs. time curve of the control tube from the temperature vs. time curve of the IO respective tube (repeated three times for statistics). Notice the improved Δheat-rate, when the IO concentration is increased.
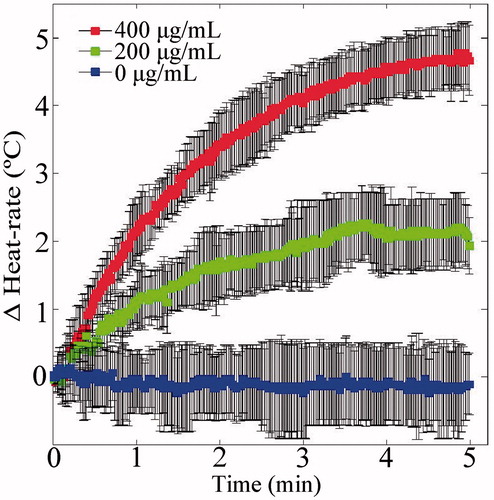
Figure 7. Transmission ultrasound imaging of the IO NPs hyperthermia augmentation phenomenon. (a) The temperature rise measured at the sensors during the heating-imaging experiment. The dash-dot (blue) and dotted (cyan) curves represent the temperature rise at the left and right test tubes as both contained water. The dashed (grey) and solid (orange) curves represent the temperature rise as the left and right test tubes were injected with the same volume of water and IO NPs, respectively. (b)–(g) Acoustic projection ΔTOF images obtained when the tubes contained water only. (h)–(m). Repeating the process after system cooling and injection of IO NPs to the right test tube (yielding a 404 µg/ml concentration), and the same volume of water to the left tube as a control. Notice the IO enhanced visualisation, due to its influence on the SOS in the baseline image (h). As MW irradiation occurred, the IO containing tube heated faster, manifested as ΔTOF increase.
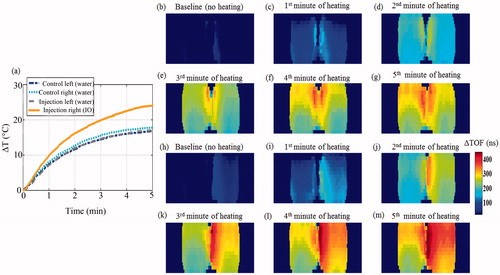
Figure 8. A calibration curve depicting the relation between the change in speed of sound ΔSOS stemming from temperature elevation of water and two IO-NPs aqueous solutions (with concentrations of 51 µg/ml and 198 µg/ml). As can be observed, the IO NPs curves are almost identical to that of water.
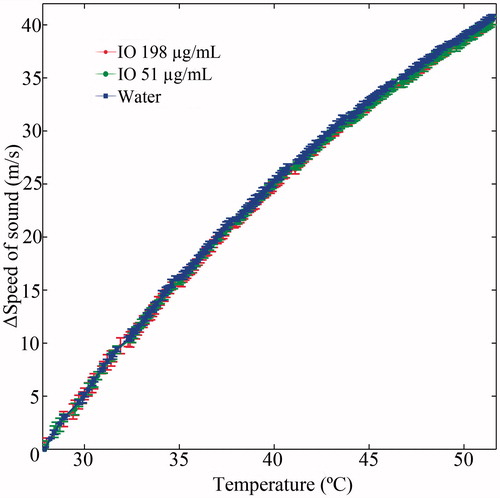
Figure 9. Characterizations of PEG-capped CuO NPs. (a) TEM image. (b) Size distribution measured by DLS (number mode). (c) FTIR spectra.
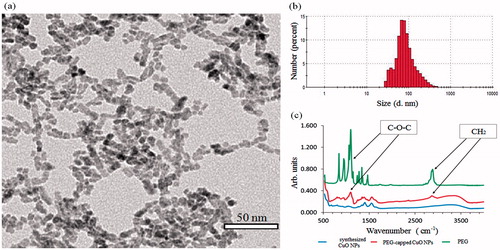
Figure 10. CuO effect on MW heating rate and transmission ultrasound contrast. (a) Heating rate curves of CuO containing aqueous solutions. Notice the similarity between the three heating curves, as no distinct trend was apparent. (b) Zoom-in view on the dashed rectangular area of the graphs depicted in (a). (c) UCT acoustic attenuation images of increasing CuO concentrations, injected to the cuboid container. No MW irradiation was performed during these scans. Notice the concentration-dependent contrast improvement.
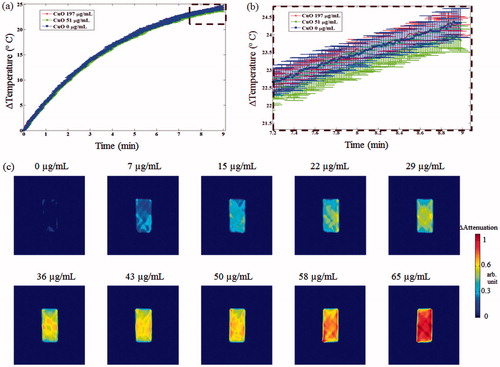
Figure 11. A two-step image guided therapeutic procedure in a heterogeneous breast phantom, using IO-based NETUS. (a) Time-of-flight based baseline projection image of the phantom. (b) A colour overlay depicting the TOF-related changes atop the baseline image, stemming from IO NPs injection (238 µg/ml concentration). The same volume of water was injected to the second target as a control, which did not alter the image as expected. (c) Another baseline image, scanned after inserting the MW antenna to the detected target borders. A Sobel edge detector was used to mark the target outline using the detected NPs location (black line). (d–f) Temperature monitoring using TOF-based changes with respect to baseline image in (c). The displayed temperatures were measured at the target zone using a sensor at the beginning of each scan.
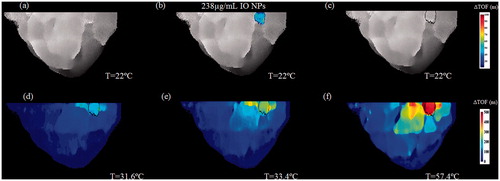
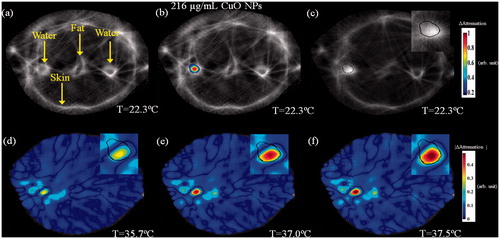
Figure 12. A two-step image guided therapeutic procedure in a heterogeneous breast phantom, using CuO-based NETUS. (a) Acoustic attenuation based, UCT cross-section baseline image of the phantom. Note the various tissues and targets embedded. (b) A colour overlay depicting the attenuation related changes atop the baseline image, stemming from CuO NPs injection to the left water-in-polyolefin target. (c) Another baseline image, scanned after inserting the MW antenna to the detected target borders. A Sobel edge detector was used to mark the target outline, using the detected CuO NPs location (black line). (d–f). Temperature monitoring using attenuation-based changes with respect to the baseline image in (c). The displayed temperatures were measured at the target zone using a sensor, at the middle of each scan. The insets in images (c–f) are a zoom-in on the CuO injected, MW antenna inserted target area.