Figures & data
Figure 1. (a) Patient 3D model in SEMCAD X with highlighted CTV and GTV (homogeneous transparent patient model was used for better visualisation of CTV and GTV). Example of treatment planning setups for all studied applicators, (b) HYPERcollar, (c) Lucite cone applicator and (d) current sheet applicator.
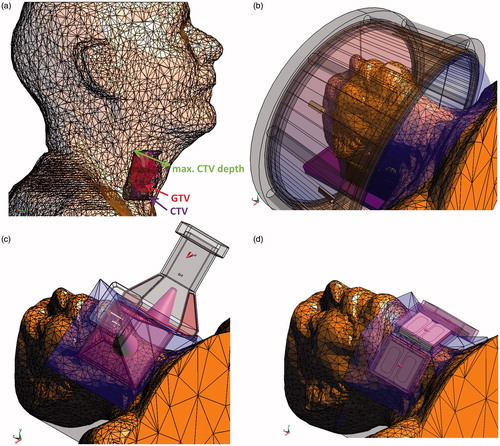
Figure 2. CTV and GTV fully (a) within the frame of the HYPERcollar, (b) under the LCA aperture.
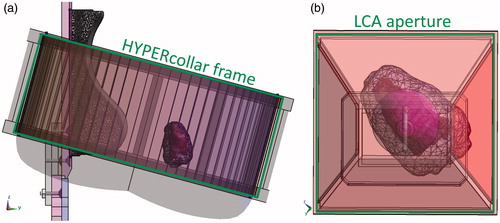
Figure 3. Piecewise linear temperature dependent perfusion scaling factors for muscle, fat and tumour. Please note that the perfusion at the specified temperature is obtained by multiplying the perfusion value at 37 °C with the temperature dependent scaling function.
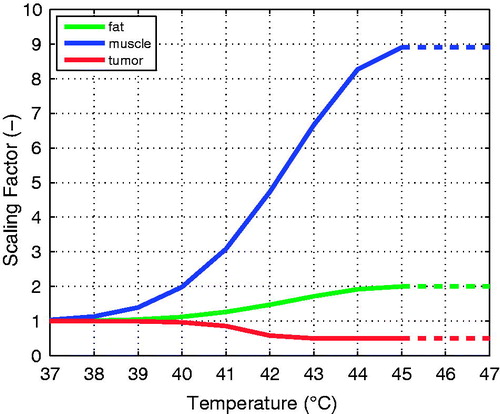
Table 1. Summary of electromagnetic simulation settings in SEMCAD X.
Table 2. Dielectric properties at 434 MHz [Citation20], thermal properties for 37 °C [Citation19], * optimised values from ten patients treated with HYPERcollar applicator [Citation21], the internal air and lung were modelled in temperature simulations using boundary condition.
Figure 4. (a) CTV and GTV volume cumulative histograms for 24 CTVs and 17 GTVs, (b) mean CTV depth profiles including minimum and maximum depth interval.
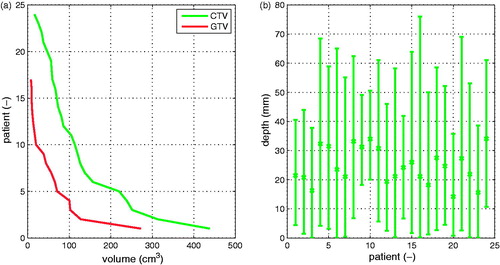
Figure 5. Example of SAR and temperature cumulative histograms and depth profiles for Lucite cone applicator (LCA), current sheet applicator (CSA) and HYPERcollar applicator (HC). CTV (a) cumulative SAR histograms; (b) constant perfusion model (ωconst.), temperature histograms; (c) temperature dependent perfusion model (ωTdep.) temperature histograms; (d) mean SAR ± standard deviation (SD) range; (e) mean temperature ± SD range for (ωconst.) and (f) mean temperature ± SD range for (ωTdep.) for CTV depth (from 18 mm to 50 mm) and all three studied applicators.
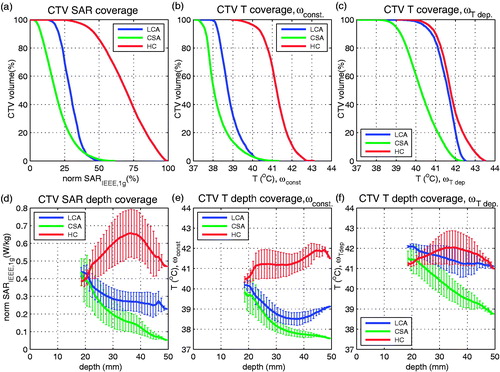
Figure 6. TC25 comparison of CTV for: (a) the Lucite cone applicator (LCA) and (b) the current sheet applicator (CSA) vs. the HYPERcollar, comparisons for CTV within HYPERcollar frame are encircled with red colour. Note that for two LCA vs. HYPERcollar comparisons we received almost identical values resulting in partly overlapping of two points.
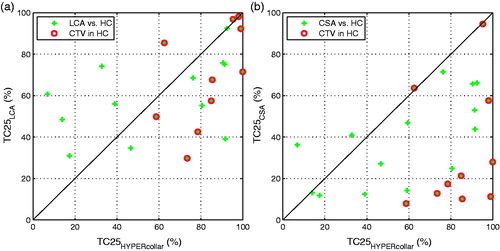
Figure 7. Example of normalised cubic-filtered SAR (%) axial slices in VEDO for (a) Lucite cone applicator, TC25 = 86%; (b) initial HYPERcollar optimisation, TC25 = 62% and (c) modified HYPERcollar optimisation which was done in order to improve TC25 = 78%, however the target-to-hotspot quotient (THQ) decreased from 1.73 for case (b) to 1.48 for case (c); for case (a) LCA THQ =1.12. Note that the CTV delineation for LCA and HYPERcollar differs slightly due to the different FDTD grid implementation in SEMCAD X.
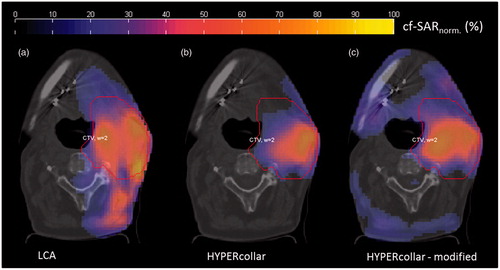
Figure 8. (a) correlations between TC25HYPERcollar–TC25LCA and 22 CTV volumes, correlations between T50HYPERcollar–T50LCA using (b) constant perfusion model and c) temperature dependent perfusion model.
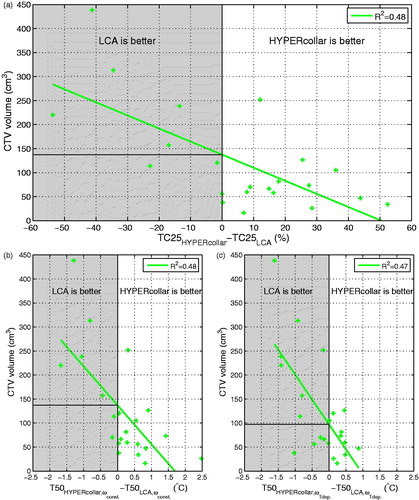
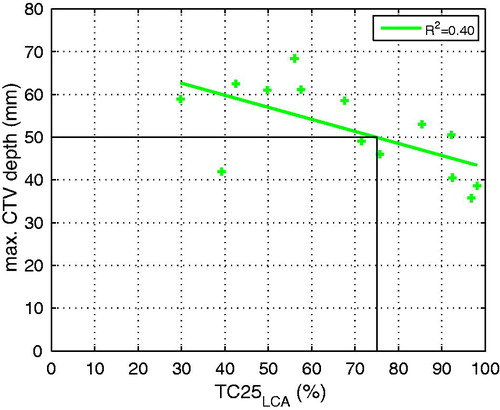
Figure 9. Dependency of TC25LCA and 14 maximum CTV depths for CTVs fully under LCA apertures. Applying a threshold of TC25 = 75%, i.e. our inclusion criteria for deep H&N HT, the maximum CTV depth is 50 mm.