
Figures & data
Table 1. NLR and tumour markers.
Figure 1. The Kaplan–Meier plot shows the disease free interval of the NLR groups and numbers at risk.

Figure 2. The Kaplan–Meier plot shows the overall survival of the NLR groups and numbers at risk.
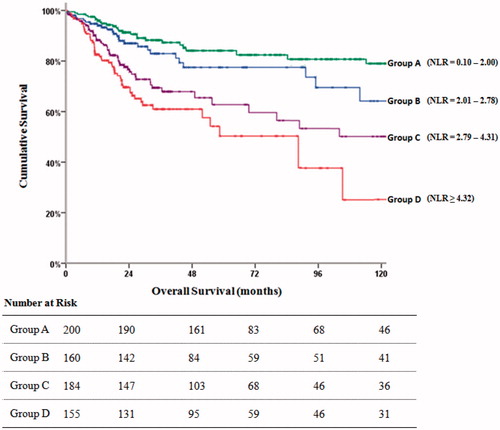
Table 2. Overall survival of grouped NLR and TMs.
Table 3. Univariate and multivariate Cox regression analysis for overall survival (OS).
Table 4. Univariate and multivariate Cox regression analysis for disease free survival (DFS).