Figures & data
Figure 1. CT scan of the liver in Case #1. A huge 11.1 × 7.5 × 9.0 cm mass was identified in segment VIII. It showed a rich blood supply within the tumour (A and B, plain scan and arterial phase, respectively). Enhanced CT scan was performed at 3 months after surgery. Post-operative image of the liver after partial resection (C). Multiple metastases were identified in the liver (D).
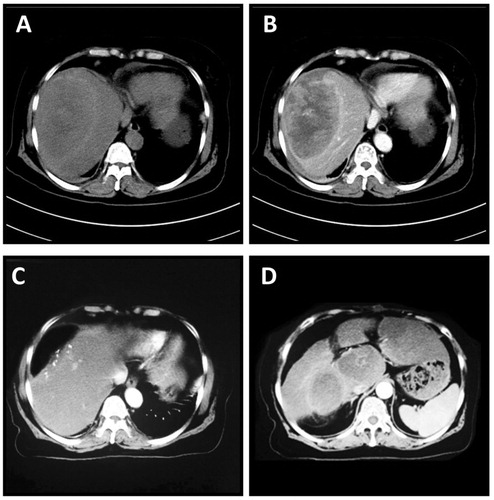
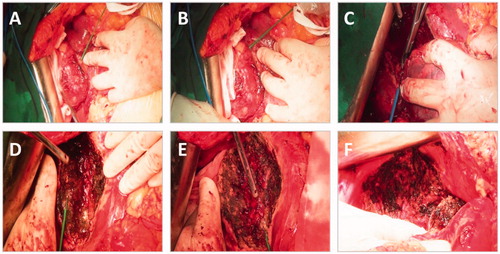
Figure 2. Pictures indicating the multiple steps of the surgery in Case #1. The microwave needle was inserted into the liver parenchyma at different sites around the tumour, and MWA was subsequently conducted (A,B). Tumor resection by the conventional clamp crushing method (C). MWA at the wound base for hemostasis (D,E). MWA of the invaded diaphragm (F).