
Figures & data
Figure 1. US-guided percutaneous MWA for hepatic cavernous haemangioma. ① microwave antennae ② a 18G PTC needle ③ probe.
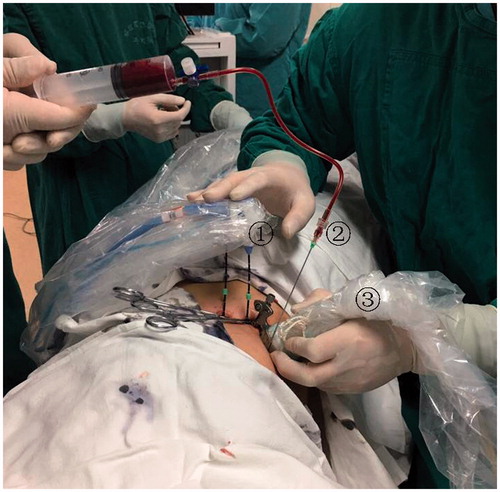
Figure 2. Images in a 50-year-old-woman who underwent MWA for hepatic cavernous haemangioma 8.8 cm in diameter. (a) Preoperative contrast-enhanced MRI showed the haemangioma was hyperenhanced in portal vein phase in left lobe and abutting the stomach (arrow). (b) The injection of normal saline (arrow) to separate the tumour and the stomach. (c) Colour Doppler ultrasonography depicts feeding arteries entering the tumour on the right side (arrow). (d) The antenna was inserted to ablate the feeding arteries (arrow). (e) US image showed the second antenna (long arrow) and the PTC needle (short arrow) were placed in the tumour. (f) US image showed the hyperechoic area of ablation covered the tumour (arrow). (g) Postoperative contrast-enhanced MRI showed complete necrosis of the tumour and the maximum diameter was reduced to 5.8 cm 3 days after MWA (arrow).
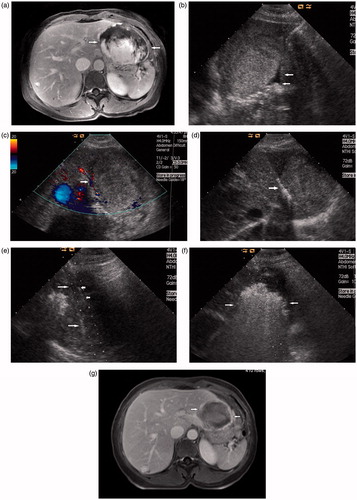
Table 1. characteristic of patient, tumour and procedure details.