Figures & data
Figure 1. Result of ALFF analysis under NC, HOT and HHC conditions. The brain region with significant ALFF difference involved in the right MPFC/ACC, bilateral PCC/PCu and right fusiform gyrus. MPFC/ACC: medial prefrontal cortex/anterior cingulate cortex; PCC/PCu: posterior cingulate cortex/precuneus; Fusiform: fusiform gyrus.
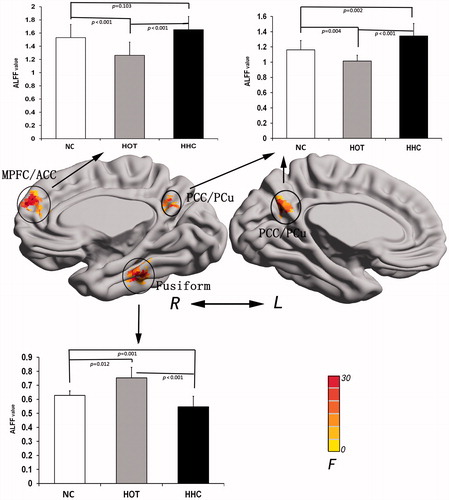
Table 1. Brain regions with significant ALFF differences among the NC, HOT and HHC conditions.
Figure 2. Results of FC analysis of each pair brain region under NC, HOT and HHC conditions. The brain region between right MPFC/ACC and bilateral PCC/PCu showed a positive correlation (red line in web/black line in print version). The brain region between right fusiform and right MPFC/ACC, bilateral PCC/PCu showed a negative correlation respectively (blue line in web/grey line in print version).
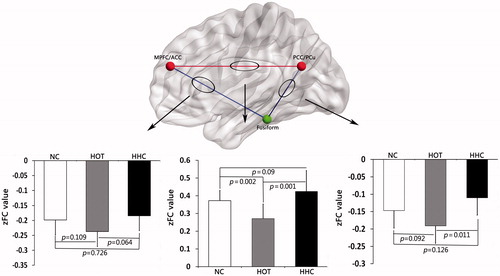
Figure 3. Body temperature of pre-experiment and post-experiment under NC, HOT and HHC conditions.
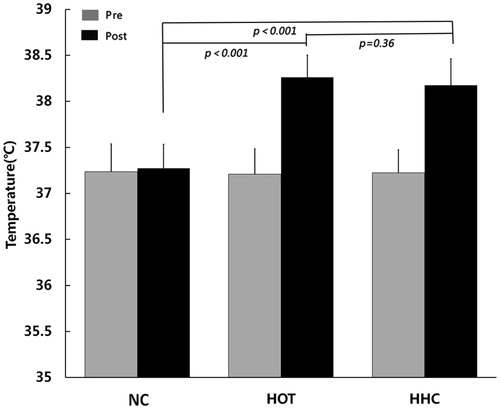
Figure 4. Mean score for subjective sensations in comfort sensation (left) and temperature sensation (right) under NC, HOT and HHC conditions.
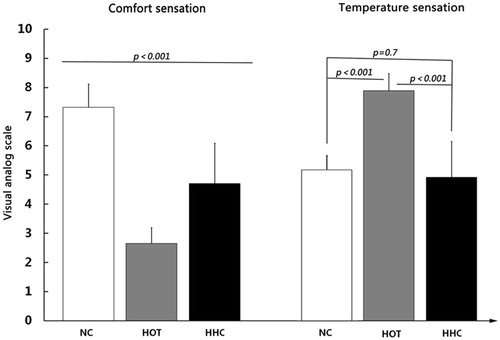
Figure 5. Correlations between comfort sensation score and ALFF value. The scatterplots of the comfort sensation score under three different conditions along the x-axis, and ALFF value along the y-axis.
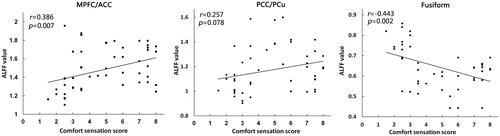
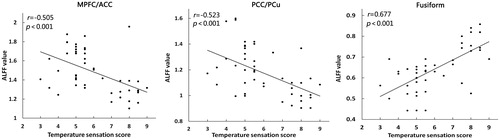
Figure 6. Correlations between temperature sensation score and ALFF value. The scatterplots of the temperature sensation score under three different conditions along the x-axis, and ALFF value along the y-axis.