
Figures & data
Figure 1. Changes in core body temperature in head-out water immersion. Data are mean ± SD. *p < 0.05, compared with before immersion. #p < 0.05, hot-HOI vs. neutral-HOI. pre: before head-out water immersion, post: at the end of head-out water immersion, post15: at 15 min after the end of head-out water immersion, post30: at 30 min after the end of head-out water immersion. Core body temperature (Tcb) at hot-HOI was significantly higher (p < 0.05) at post and was still elevated at post15, but recovered to pre level at post30. Tcb did not change during the entire neutral-HOI arm of the study. Tcb at hot-HOI at post and post15 were significantly (p < 0.05) higher than those at neutral-HOI.
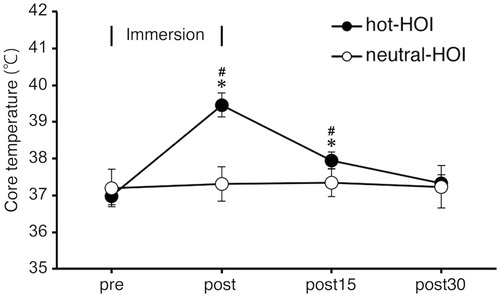
Table 1. Change in heart rate (HR) and mean arterial pressure (MAP) in head-out water immersion.
Figure 2. Changes in serum BDNF in head-out water immersion. The centre of each bar represents the mean value for each time period and the length of the bar represents the SD value. *p < 0.05, compared with before immersion. #p < 0.05, hot-HOI vs. neutral-HOI. Each figure should show one open symbol (neutral HOI) and one solid symbol (hot-HOI). See for definitions. Serum BDNF concentration was significantly higher (p < 0.05) at post and was still high at post15, but returned to pre level at post30. No change was observed in serum BDNF concentration throughout the study in the neutral-HOI. Serum BDNF levels of hot-HOI at post, post15 and post30 were significantly (p < 0.05) higher than those of neutral-HOI.
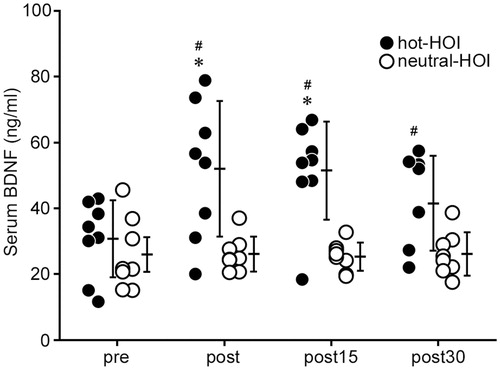
Figure 3. Changes in serum S100β in head-out water immersion. See and for definitions. Serum S100β did not change throughout the hot-HOI and neutral-HOI tests, and was not significantly different between hot-HOI and neutral-HOI at the four different time points.
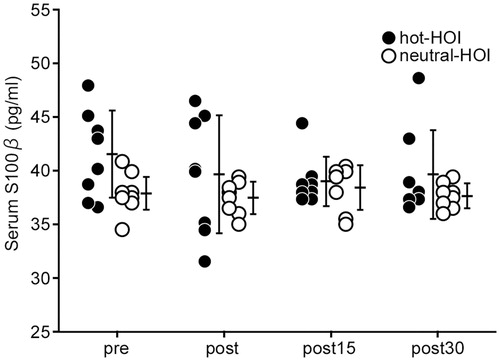
Figure 4. Changes in plasma cortisol in head-out water immersion. *p < 0.05, compared with before immersion. See and for definitions. In the hot-HOI experiment, plasma cortisol level decreased (p < 0.05) at post but returned to pre level at the two recovery time points, while it did not change throughout the neutral-HOI study. Plasma cortisol was not significantly different between hot-HOI and neutral-HOI at the four different time points.
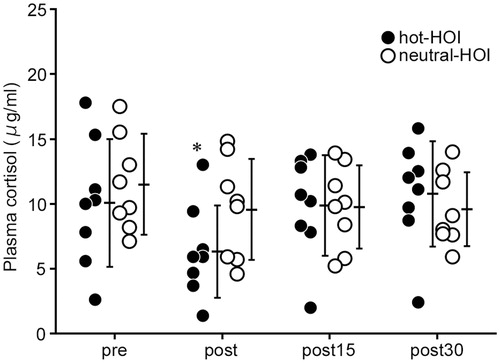
Table 2. Blood cell counts, platelet and monocytes during head-out water immersion.