Figures & data
Figure 1. (A) Coronal maximum intensity projection (MIP) illustrates where data were acquired and quantified from four anatomical locations along the body of adult and aged, male and female murine models. (B) Sagittal partial MIP illustrates where data were acquired and quantified in the periphery. CoW = circle of Willis, Saph = saphenous, Pop = popliteal.
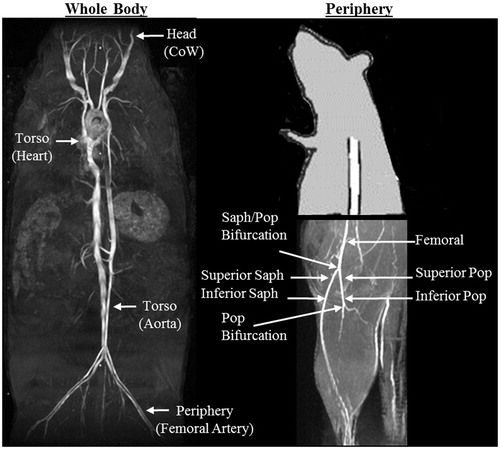
Figure 2. Representative images from the four anatomical locations of an adult male mouse, acquired at 35 and 38 °C. Circle of Willis (CoW): Coronal (top) and sagittal (bottom) maximum intensity projections (MIPs) showing no qualitative difference in the CoW. Area of the middle (MCA) and anterior (ACA) cerebral artery remained constant as temperature increased. Heart: Long axis view of the heart at end-diastole and end-systole shows an increase in the volume of the right (RV) and left ventricle (LV) for both cardiac phases at higher core temperature. Periphery: Sagittal partial MIPs of hindlimb. The conspicuity of the femoral, saphenous (saph), and popliteal arteries increases with increased temperature due to an increase in vessel area and potentially blood velocity. Aorta: Cross-sectional view of the infrarenal aorta and inferior vena cava (IVC) with the same-sized region of interest around the aorta at diastole and systole. Average cross-sectional area of the aorta increased significantly and linearly with increasing temperature.
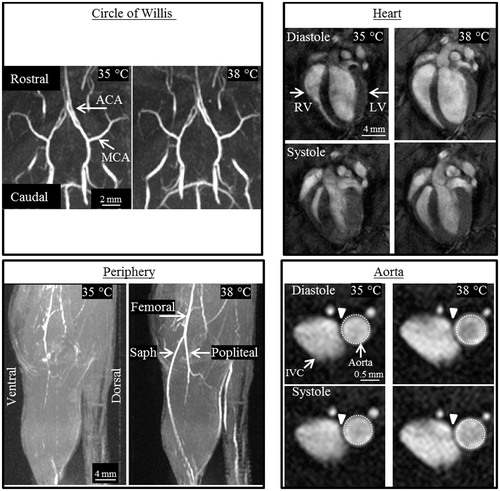
Table 1. Summary of results. Data presented as mean ± SEM, or for group comparisons slopes and percent change per degree. Non-significant group comparisons of (%/°C) show adjusted means, for sex and age, averaged across the three temperature intervals. Temperature-interval specific data are listed for the femoral artery, the only location where relative changes within a given one degree interval differed by sex or age.
Figure 3. Cross-sectional area of the infrarenal aorta across the cardiac cycle for male and female, adult and aged mice (n = 20, 5 per group) at core temperatures of 35, 36, 37 and 38 °C. Average area increased with increasing temperature. Aged animals span a smaller range of values from 35 to 38 °C compared to adult animals, corresponding to a reduction in the rate of area increase. Fraction of cardiac cycle: systolic peak ∼0.4, diastolic peak ∼1. Images are acquired for just over one complete cardiac cycle to insure MRI data accurately captures systole and diastole. Error bars omitted for clarity.
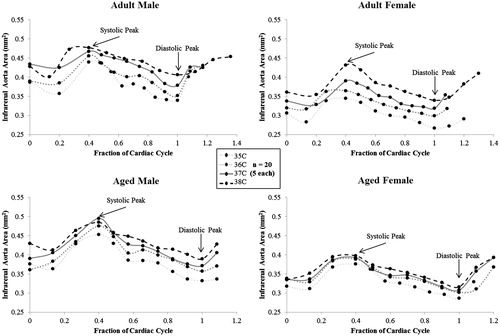
Figure 4. Average cross-sectional area (left y-axis) and maximum circumferential cyclic strain (right y-axis) of the infrarenal aorta for male and female, adult and aged mice (n = 20, 5 per group) at core temperatures of 35, 36, 37 and 38 °C. Linear regression lines shown for area and strain. As the average area of the vessel increases, the cyclic strain decreases. Significance set at p < 0.05; for temperature effect overall (†), pairwise comparisons between temperatures within a group (#) and non-zero slope (*).
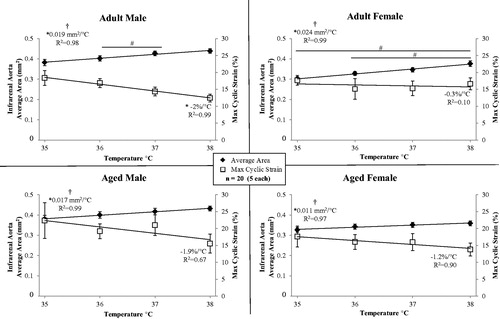
Figure 5. Cross sectional area of the peripheral arteries from 3 D scans for male and female, adult and aged mice (n = 5 each) at core temperatures of 35, 36, 37 and 38 °C. The majority of arteries increased in size with increased temperature. Aged males had a diminished response to temperature. For the saphenous artery, number of animals for which signal was present is indicated by (number). Significance set at p < 0.05: for temperature effect overall (†), pairwise comparisons between temperatures within a group (#), relative changes to same age group but opposite sex ($), relative changes to same sex but different age group (@) and non-zero slope (*).
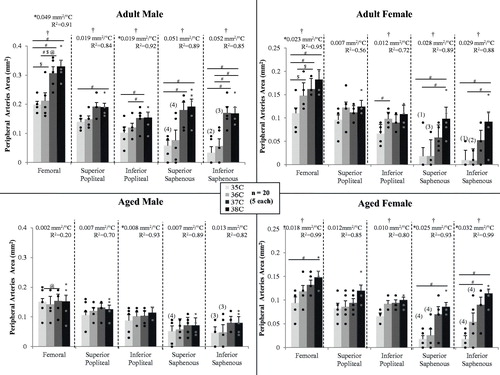
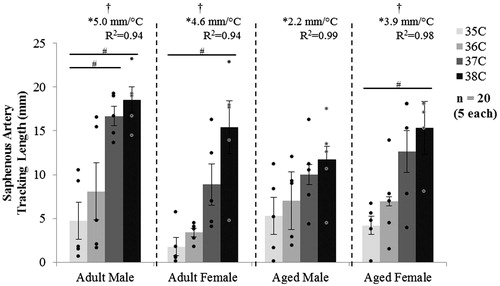
Figure 6. MRI tracking length of the saphenous artery for male and female, adult and aged mice at core temperatures of 35, 36, 37 and 38 °C (n = 5 each). The tracking length increased with increased temperature. Significance set at p < 0.05 for temperature effect overall (†), pairwise comparisons between temperatures within a group (#) and non-zero slope (*).