Figures & data
Figure 1. Microwave Ablation system and ex vivo perfusion system. (a) MWA system – Acculis MTA system® (AngioDynamics, Denmead, Hampshire). (b) MW applicator – Acc2i pMTA 14cm standard applicators (AngioDynamics, Denmead, Hampshire). (c) Ex vivo perfusion system –diagram showing the ex vivo perfused pig liver model. The perfusate was O-ve human blood (time expired) oxygenated using a mixed gas containing 14% O2, 5% CO2 and 81% N2 and warmed to 370 °C using the heat exchanger of the oxygenator. HA: Hepatic artery; PV: Portal vein; LDF: Laser Doppler Flowmetry; MW: Microwave.
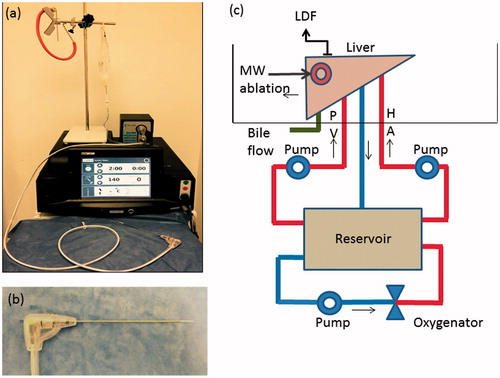
Figure 2. Sampling method for Haematoxylin and Eosin (H&E) and nicotinamide adenine dinucleotide (NADH) staining. Schematic representation of the method of bisecting the ablation zone and obtaining sections for snap freezing. The ablation zone is bisected along the plane of the probe and one half is fixed in formalin for processing for histology. A 5-mm slice is obtained from the other half which is mounted with the plane of the probe facing up and snap frozen in liquid nitrogen prior to obtaining cryosections.
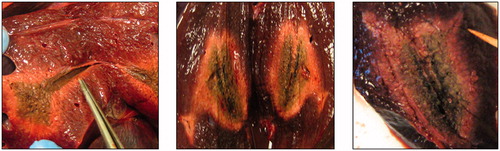
Figure 3. Macroscopy of microwave ablation zone. Macroscopic appearances of the extension zone along vessels in three different ablation zones. These ablation zones demonstrate the zonal anatomy of a central dark zone (carbonised tissue), surrounding white zone (non-carbonised thermal coagulation) and an outer red zone (boundary of the ablation zone).
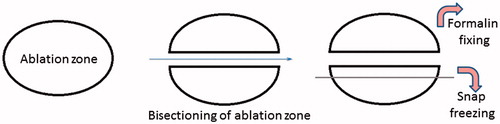
Figure 4. Comparison of Microwave ablation (MWA) zone characteristic with the Magnetic resonance (MR) image appearance. (a) A macroscopic section showing the extension of the ablation zone along a hepatic vein on the leftmost ablation zone (arrow) at an approximately similar plane as the following MR image. Zonal anatomy of the ablation again demonstrated with a central dark (carbonised) zone, inner white zone (coagulated) and outer zone (boundary). (b) Axial 3D Fast low angle shot gradient echo sequence with water selective excitation (3D WATSf) image showing two ablation zones at a similar plane to macroscopic slice. The peripheral, higher signal component of the leftmost ablation zone extends along the adjacent hepatic veins (arrow).
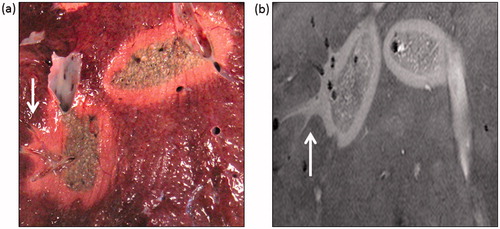
Figure 5. Magnetic resonance appreance of T1 and T2 weighted images and 3dWatSF imges. (a) T1-weighted imaging, turbo spin echo (T1W TSE) shows two ablation zones. Each ablation zone demonstrates zonal anatomy; an outer hyperintense rim, inner hypointense T1 signal, and further hypointense central region. compared to background liver. (b) T2-weighted imaging, turbo spin echo (T2W TSE) also shows an outer zone which is slightly hyperintense and a hypointense inner and central zone. (c) 3d WATSf imaging shows a hyper intense rim and predominantly isointense inner and central zone.
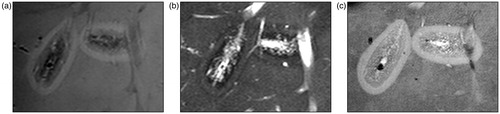
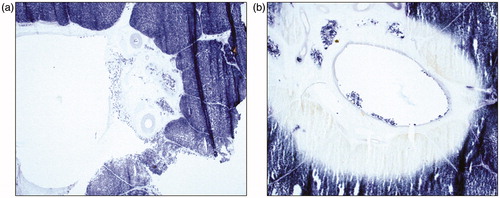
Figure 6. Nicotinamide adenine dinucleotide (NADH) staining. Extension of the ablation zone in the perivascular region demonstrated by zone of absent blue formazan deposit in the nuclei as well as the cytoplasm in the perivascular zone in a vessel with extension of MWA.