
Figures & data
Figure 1. (a) Pattern diagrams of the conventional setting in the phantom study. (b) The distributions of the temperature increase in the phantom for the conventional setting. The superficial area was cooled by the overlay bolus, while the deep area was uniformly heated (with the exception of the external border).
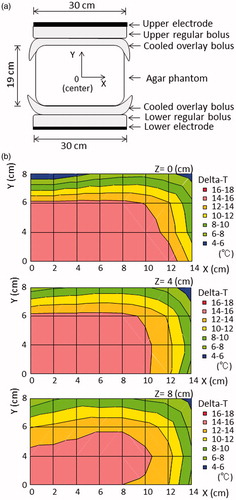
Figure 2. (a) Pattern diagrams of the insulator sheet with a hole in the centre, defined as setting number 1. The insulator sheet was inserted between the regular bolus and the cooled overlay bolus in both the upper and lower sides of the electrode. (b) The distribution of the temperature increase in the phantom with setting number 1.
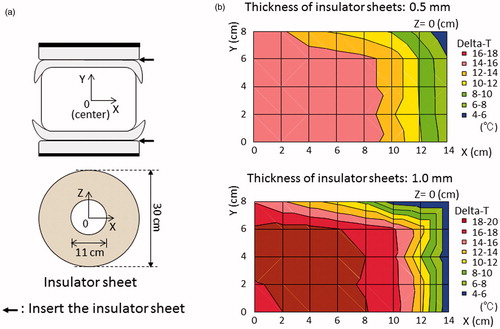
Figure 3. (a) Pattern diagrams in the phantom for setting number 2. The insulator sheets were alternately arranged in a circular sector shape at an angle of 270° and were inserted between the regular bolus and cooled overlay bolus in both the upper and lower sides of the electrode. (b) Pattern diagrams of setting number 3 in which mobile insulator sheets were used. The insulator sheets, which were prepared in a circular sector shape, the same as in setting number 2, were manually rotated in parallel at an angle of 90° at 5 min intervals during heating. (c) The distribution of the temperature increase with setting number 2. (d) The distributions of the temperature increase in setting number 3 in which mobile insulator sheets were used.
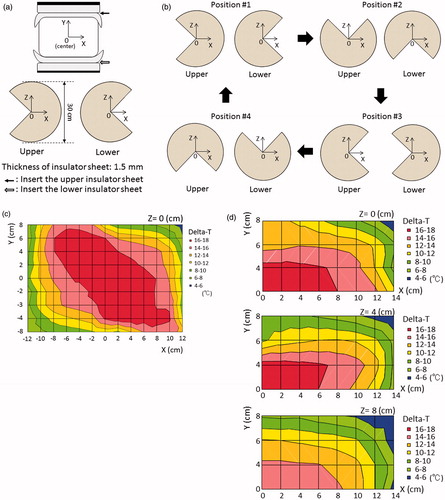
Table 1. Dielectric and materials properties used for the simulations at 8 MHz.
Figure 4. (a) Pattern diagrams for the 3 D SAR simulation using the agar phantom. (b) SAR distribution in the phantom for the conventional setting. (c) SAR distribution in the setting number 1. (d) SAR distribution in the setting number 1 at an oblique angle. (e) SAR distribution in setting number 3 at position #1. (f) SAR distribution in setting number 3 at position #1 at an oblique angle.
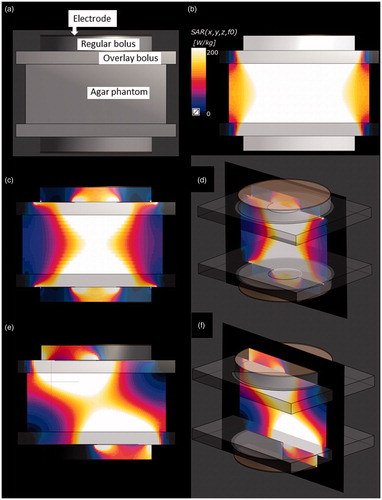
Figure 5. (a) Segmented CT slice of the caudal area showing the bone (blue), muscle (yellowish green), prostate (red) and subcutaneous fat (SF) of the right ventral area (pink), left ventral area (white), right dorsal area (orange), left dorsal area (green) and other fat (yellow). (b) Colour scale bar of the SAR distribution. (c) SAR distribution in the 3 D anatomical model for the conventional setting. Constant potential was set at 117 V. (d) Sagittal view of the SAR distribution in the conventional setting. (e) SAR distribution in setting number 1. Constant potential was set at 166.7 V. (f) Sagittal view of the SAR distribution in setting number 1. (g) SAR distribution in setting number 3 at position #1. Constant potential was set at 166.7 V for setting number 3. (h) Sagittal view of the SAR distribution in setting number 3 at position #2. (i) SAR distribution in setting number 3 at position #3. (j) Sagittal view of the SAR distribution in setting number 3 at position #4.
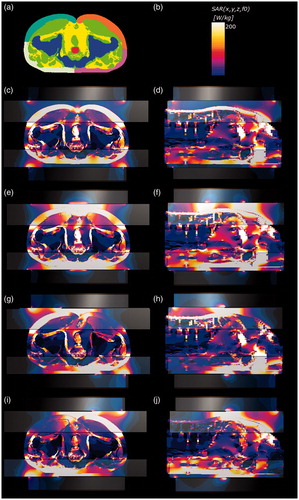
Table 2. Three-dimensional SAR simulations using the 3 D patient model.
Table 3. The thermal parameters in the HT sessions with the conventional setting and with setting number 1 (insulator sheets with a hole in the centre).
Table 4. the thermal parameters in HT sessions with the conventional setting and with setting number 3 (using mobile insulator sheets).
Table 5. Comparisons of the thermal parameters in setting number 3 (using mobile insulator sheets) by the order of the HT sessions.