
Figures & data
Figure 1. A 46-year-old female patient with abdominal wall implants from hepatocellular carcinoma (HCC) after US-MWA treatment. US image shows one low level echo mass (3.1 × 2.5 × 2.2 cm) located on the abdominal wall (blue arrow). There is a high level echo field located behind the mass, and it is MWA field (red arrow).
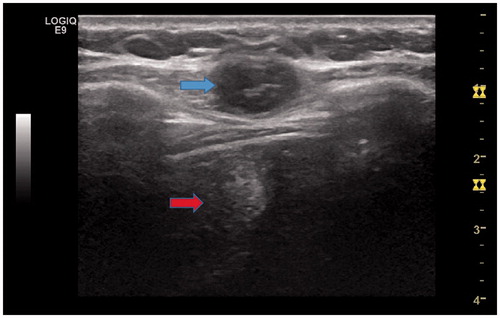
Figure 2. Sixty-four year old male with abdominal wall implants from hepatocellular carcinoma (HCC). (A) Two nodules were found in the right abdominal wall in the arterial phase in the axial enhanced MRI (arrow) before US-guided MWA, and one was measured in 3.3 × 3.2 × 2.1 cm, another one was in 1.3 × 1 × 0.8 cm. (B) Two nodules were treated after 1 month undergoing US-guided MWA. The thermal ablation field was found in the right abdominal wall in the delay phase in the axial enhanced MRI (arrow).
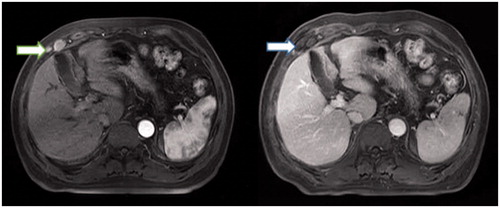
Table 1. Baseline characteristics of patients undergoing MWA and SR.
Table 2. The pre-operative liver function in two groups.
Figure 3. (A) Graph shows the 1-, 3- and 5-year overall survival rates in the MWA group and SR group; (B), Graph shows the 1-, 3- and 5-year disease-free survival rates in the MWA group and SR group; (C) Graph shows the 3-, 6-, 12-, 18- and 24-month local tumour reoccurrence-free (LTRF) rates in the MWA group and SR group.
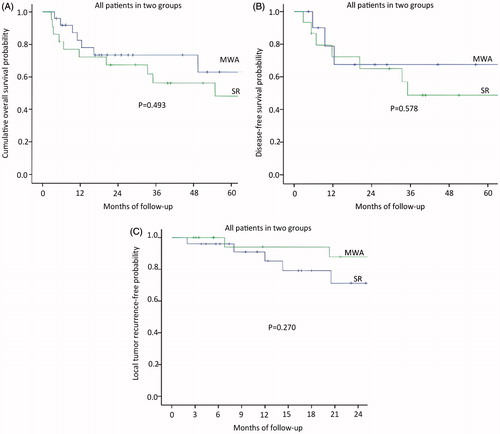
Figure 4. The patients of intrahepatic HCC well controlled or stable in two groups. (A) Graph shows the 1-, 2- and 3-year overall survival rates in the MWA group and SR group; (B) Graph shows the 1-, 2- and 3-year disease-free survival rates in the MWA group and SR group; (C) Graph shows the 3-, 6-, 12-, 18- and 24-month local tumour reoccurrence-free (LTRF) rates in the MWA group and SR group.
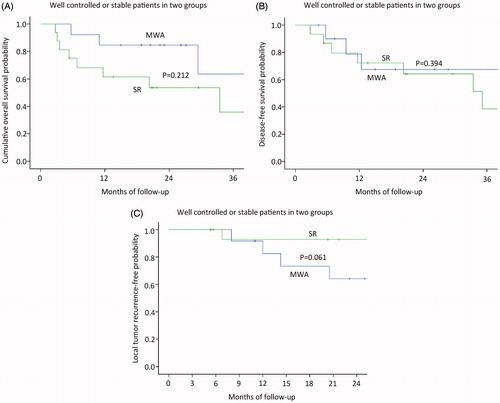
Figure 5. The patients of intrahepatic HCC poorly controlled in two groups. (A) Graph shows the 1-, 2- and 3-year overall survival rates in the MWA group and SR group; (B) Graph shows the 3-, 6-, 12-, 18- and 24-month local tumour reoccurrence-free (LTRF) rates in the MWA group and SR group.
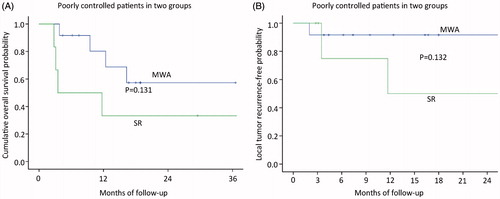
Table 3. Univariable analysis of factors affecting overall survival.
Table 4. Multivariate analysis of prognostic factors with cox proportional hazards model.