Figures & data
Figure 1. Imaging analysis method of CD31 immunostaining results. All stains were scanned using an Aperio AT2. The lumens of all stained vessels were manually marked using an Aperio imagescope programme.
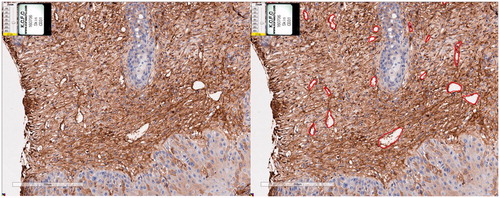
Figure 2. Imaging analysis method of dynamic thermal imaging. The target site was selected by imaging software and the thermal change of the selected region of interest was analysed.
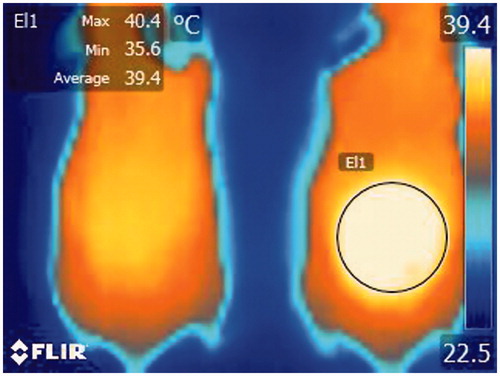
Figure 3. Clinical photographs of hairless albino (Crl:SKH1-h) mice from control (week 1) to week 14. The mice developed erythema and desquamation after 1 week of UV exposure. By 7 weeks, erythematous protruding nodule begins to appear on some mice. The size and numbers of nodules, and the degree of hyperkeratosis increased as UV exposure proceeded.
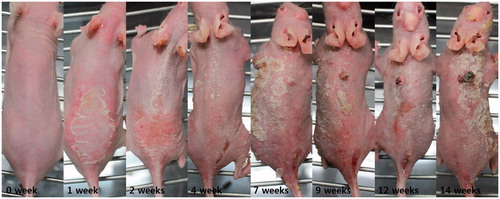
Figure 4. (a) Hematoxylin and eosin (H&E) stain of control group. (b) H&E stain of week 6 showing dyskeratotic keratinocytes constituting lower one-third to two-thirds of epidermis. (c) H&E stain of week 14 showing dermal invasion of dyskeratotic keratinocytes. (d) Ki stain of week 8 showing mitosis limited to lower one-third of epidermis (e) Ki stain of week 14 showing mitosis present in dermis as well as epidermis.
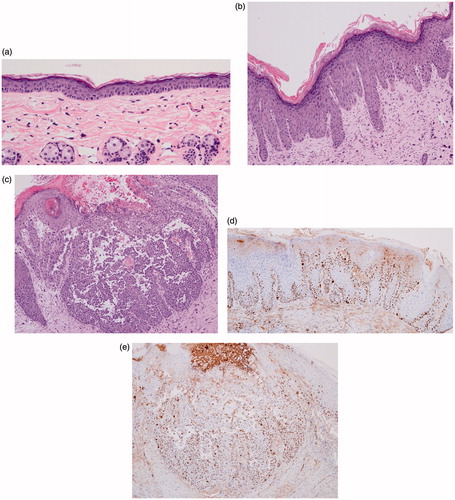
Figure 5. (a) CD 31 stain of week 7. (b) CD 31 stain of week 13 showing increased vascularity. (c) Vascularity index graph with UV exposure. Although the vascularity index fluctuated slightly, it generally tends to increase as UV exposure increases.
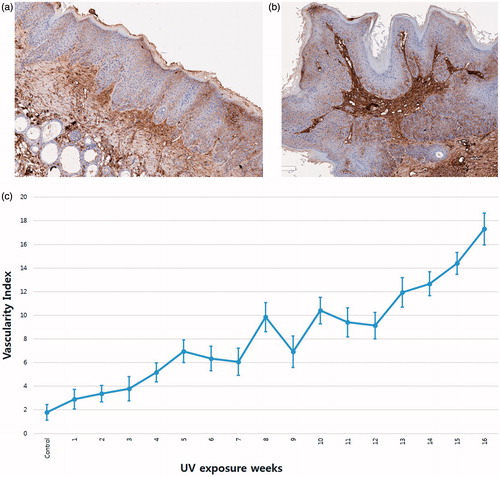
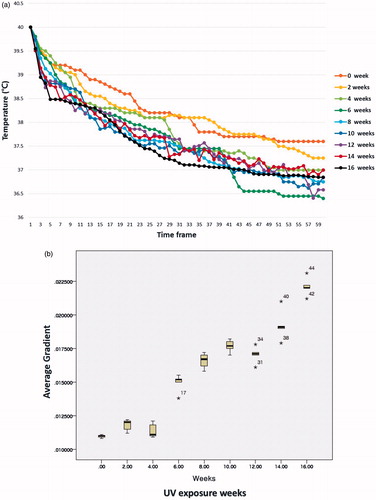
Figure 6. (a) Comparison of the early thermal response graphs of mice at different lengths of UV exposure revealed faster thermal recovery to basal level as UV exposure increased. (b) Tukey or Duncan analysis of average gradient significantly grouped the UV exposure weeks into five groups; 0 to 4, 6, 8 to 12, 14 and 16 weeks.