
Figures & data
Table 1. Patient demographics.
Table 2. Demographics per gender.
Figure 1. (A) Face fluoroscopy view of the left knee illustrating the final position of the trocar at the level of the tibial crest. (B) Lateral fluoroscopy of the left knee illustrating the final position of the trocar anteriorly to the tibial crest. (C) The RF electrode is coaxially inserted in the knee joint through the trocar and connected to the generator.
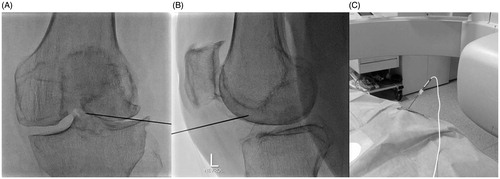
Figure 2. Image illustrating the monitor of the generator during the intra-articular application of pulsed RF inside the knee joint.
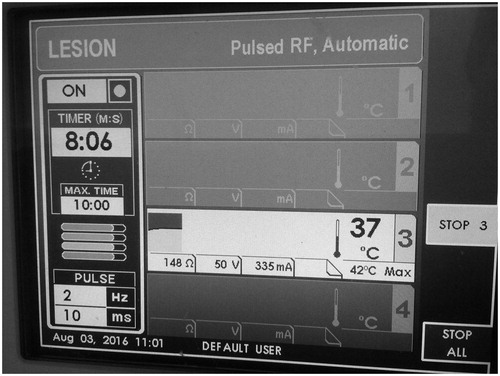
Figure 3. Charts illustrating mean pain scores and score deviation prior and during the follow-up period.
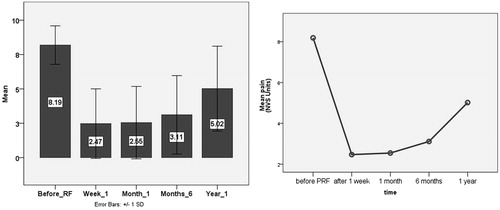
Table 3. Descriptive statistics.