1,952
Views
18
CrossRef citations to date
0
Altmetric
Research Article

Effects of a microbubble ultrasound contrast agent on high-intensity focused ultrasound for uterine fibroids: a randomised controlled trial

ORCID Icon, , , , , & show all
Pages 1311-1315 | Received 26 Jul 2017, Accepted 27 Nov 2017, Published online: 04 Jan 2018

Figures & data

Table 1. Contributing factors and group assignments.

Figure 1. A 45-year-old patient with an 8.7 × 8.5 × 8.3 cm uterine fibroid and the significant grey-scale change during HIFU treatment. (A) Before HIFU treatment, ultrasound showed a hypoechoic fibroid (arrow). (B) Immediately after HIFU treatment, ultrasound showed a lumpy grey-scale change in the treatment area (arrow). (C) Before HIFU treatment, contrast-enhanced ultrasound showed the tumour perfusion area (arrow). (D) Immediately after HIFU treatment, contrast-enhanced ultrasound showed no enhancement surrounding the fibroid (arrow), indicating complete ablation. (E) Pre-treatment enhanced T1-weighted MRI showed tumour perfusion (arrow). (F) Post-treatment enhanced T1-weighted MRI showed a small area of enhancement along the tumour edges, with an ablation rate of 94% (arrow).

Figure 1. A 45-year-old patient with an 8.7 × 8.5 × 8.3 cm uterine fibroid and the significant grey-scale change during HIFU treatment. (A) Before HIFU treatment, ultrasound showed a hypoechoic fibroid (arrow). (B) Immediately after HIFU treatment, ultrasound showed a lumpy grey-scale change in the treatment area (arrow). (C) Before HIFU treatment, contrast-enhanced ultrasound showed the tumour perfusion area (arrow). (D) Immediately after HIFU treatment, contrast-enhanced ultrasound showed no enhancement surrounding the fibroid (arrow), indicating complete ablation. (E) Pre-treatment enhanced T1-weighted MRI showed tumour perfusion (arrow). (F) Post-treatment enhanced T1-weighted MRI showed a small area of enhancement along the tumour edges, with an ablation rate of 94% (arrow).

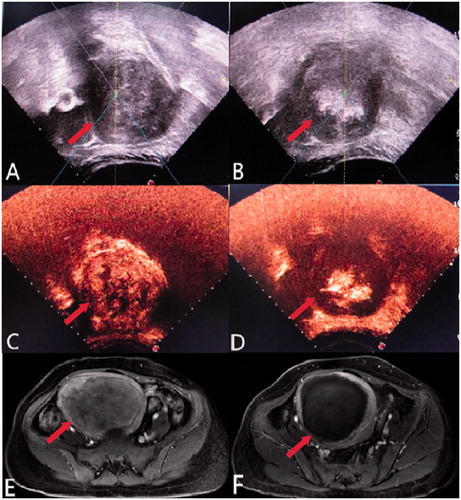
Table 2. General information for thefour groups (X¯ ± S).

Table 3. Comparison of the treatment outcomes among the four groups.

Table 4. Comparison of the treatment outcomes among the four groups.

Table 5. Comparison of intra-procedure and post-procedure adverse effects.