1,698
Views
36
CrossRef citations to date
0
Altmetric
Research Article

Safety margin after radiofrequency ablation of hepatocellular carcinoma: precise assessment with a three-dimensional reconstruction technique using CT imaging

, , , , &
Pages 1135-1141 | Received 29 May 2017, Accepted 28 Nov 2017, Published online: 02 Feb 2018

Figures & data

Figure 1. Flow diagram of the study.

Figure 1. Flow diagram of the study.

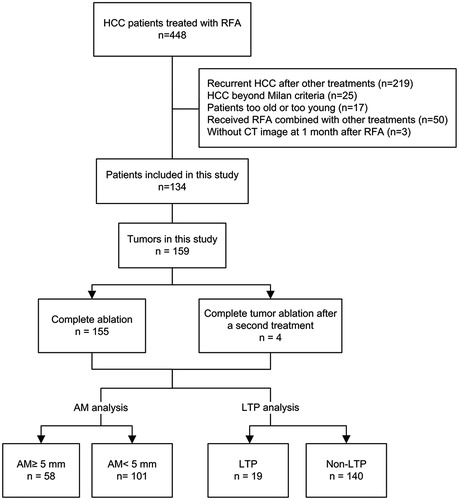
Table 1. Clinical characteristics of the enrolled patients with HCC (n = 134).

Figure 2. Images of a 54-year-old male patient with HCC who was treated with RFA. Among the three treated lesions, LTP occurred in one tumour at 9 months after treatment. (A) Conventional axial CT image in the portal phase shows HCC before ablation; (B) conventional axial CT image in the portal phase 1 month after ablation shows complete ablation; (C) conventional axial CT image in the portal phase when LTP (black arrow) is detected; (D, E) combined 3D images of the initial tumour (obtained before ablation), the ablation zone (obtained 1 month after ablation) and LTP (obtained 9 months after ablation) in various directions show their spatial relationship; (F) local enlargement images show the position relationship of the initial tumour, the ablation zone and LTP. On this image, the LTP-associated AM is 6.7 mm.

Figure 2. Images of a 54-year-old male patient with HCC who was treated with RFA. Among the three treated lesions, LTP occurred in one tumour at 9 months after treatment. (A) Conventional axial CT image in the portal phase shows HCC before ablation; (B) conventional axial CT image in the portal phase 1 month after ablation shows complete ablation; (C) conventional axial CT image in the portal phase when LTP (black arrow) is detected; (D, E) combined 3D images of the initial tumour (obtained before ablation), the ablation zone (obtained 1 month after ablation) and LTP (obtained 9 months after ablation) in various directions show their spatial relationship; (F) local enlargement images show the position relationship of the initial tumour, the ablation zone and LTP. On this image, the LTP-associated AM is 6.7 mm.

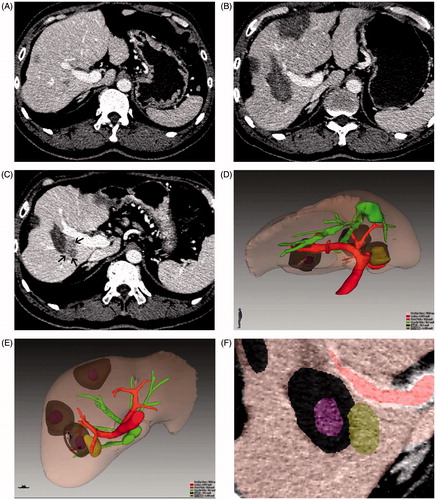
Table 2. Comparison of tumour characteristics according to local tumour progression.

Figure 3. Comparison of cumulative local tumour progression rates according to min-AM (A) and tumour size (B).

Figure 3. Comparison of cumulative local tumour progression rates according to min-AM (A) and tumour size (B).

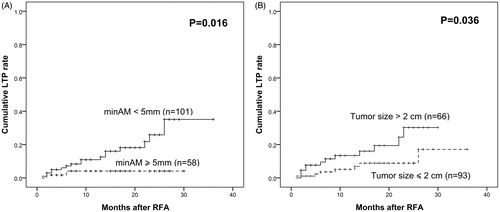
Table 3. Univariate and multivariate analysis of possible risk factors for local tumour progression.

Supplemental material

Reprints and Corporate Permissions

Please note: Selecting permissions does not provide access to the full text of the article, please see our help page How do I view content?

To request a reprint or corporate permissions for this article, please click on the relevant link below:

Academic Permissions

Please note: Selecting permissions does not provide access to the full text of the article, please see our help page How do I view content?

Obtain permissions instantly via Rightslink by clicking on the button below:

If you are unable to obtain permissions via Rightslink, please complete and submit this Permissions form. For more information, please visit our Permissions help page.