Figures & data
Figure 1. Schematics of experimental setup for millifluidic release assay. A TSL solution (TSL + buffer) is pumped through a capillary tube. The tube is heated to the desired temperature by a temperature controlled Peltier element. Once the TSL solution enters the heated region, TSL release the fluorescent drug/dye, resulting in a fluorescence gradient along the tube (upper graph). The Peltier temperature is measured by a thermocouple and a control algorithm regulates the power applied to the Peltier element to control temperature.
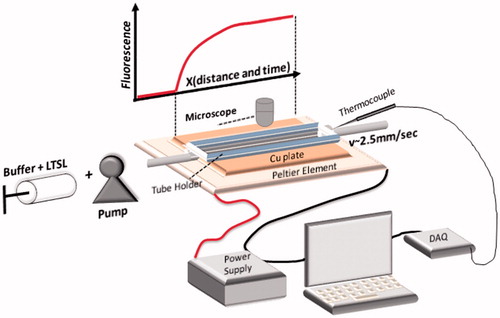
Figure 2. Calibration plot for converting SRB fluorescence intensity to temperature (A). Unencapsulated dye was pumped through the capillary tube which was heated to 43 °C. Temperature along the tube distance was calculated based on the calibration plot (B). Fluid entering the capillary tube reached the target temperature within ∼3 mm, corresponding to ∼0.3 s (flow velocity =10 mm/s). Fluorescence image of SRB pumped through the tube at 2.5 mm/s @ 16 ms exposure time, demonstrating no detectable variation in arrival time across the tube diameter (C).
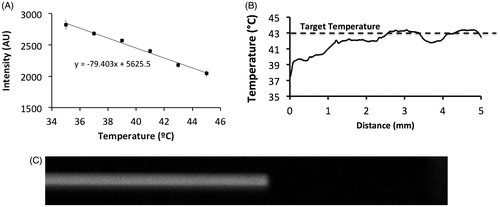
Figure 3. Release of CF from TSL along tube distance, for three different flow velocities (A). Percent release vs. time is independent of flow velocity (B). A sample microscope image demonstrating the fluorescence gradient along the tube resulting from TSL releasing CF (C).
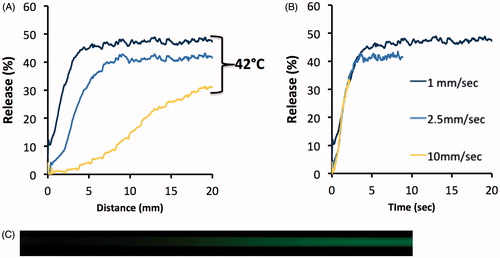
Figure 4. Release of CF from MSPC-LTSL at 42 °C. Percent CF release over 30 s is plotted comparing the traditional cuvette method – whereby a single data point is acquired every 8 s – to the novel millifluidic method whereby release data is acquired continuously. Data plots represent the mean of three experiments.
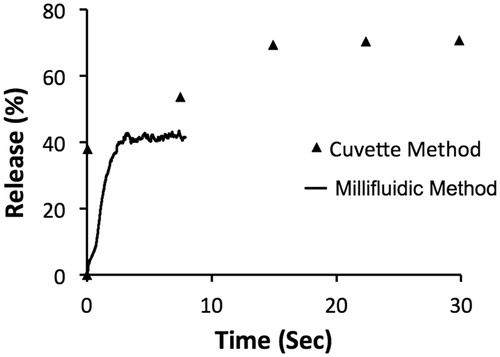
Figure 5. Release of four compounds from MSPC-LTSL at 37 and 42 °C was measured with the traditional cuvette method over 10 min (A) and with our millifluidic device over 6 s (B).
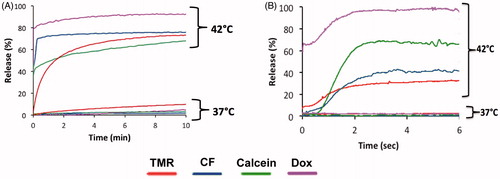
Figure 6. Release of carboxyfluorescein from MSPC-LTSL at various temperatures in different buffers: PBS, 10% BSA solution, FBS or human plasma.
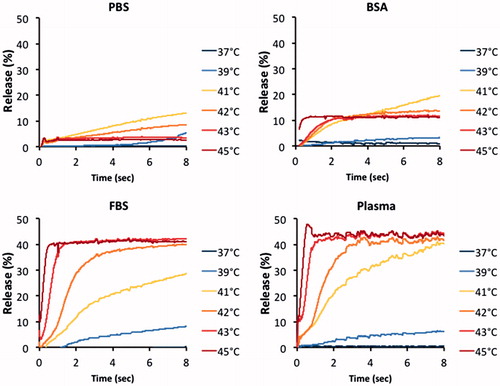
Figure 7. Release of CF from MSPC-LTSL at 42 °C in different buffers: PBS, 10% BSA solution, FBS or human plasma. Results are shown for measurements using the traditional cuvette method over 10 min (A) and using the millifluidic method over 6 s (B).
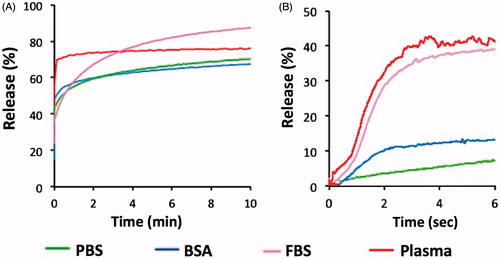
Table 1. Release of carboxyfluorescein from MSPC-LTSL at various temperatures in different buffers (data from ) was fitted to an exponential model. Fitted parameter values are reported in the table. Fitting was not performed for any data at 37 °C or for BSA/PBS at 39 °C, due to inadequate fit (R^2 < 0.3). Fitting was performed based on mean of data in .
Figure 8. Release of CF at 42 °C from three TSL formulations. Results are shown for measurements using the traditional cuvette method over 10 min (A) and using the millifluidic method over 6 s (B).
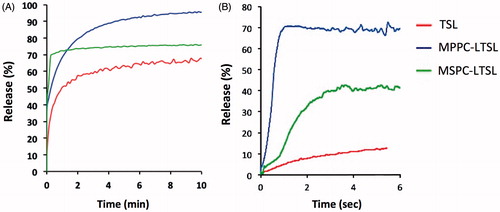
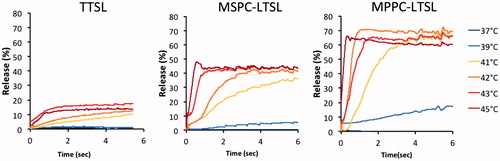
Figure 9. Release of (CF at various temperatures from three TSL formulations, measured using the millifluidic method.