
Figures & data
Figure 1. Temperatures and times for thermal damage within tissue.
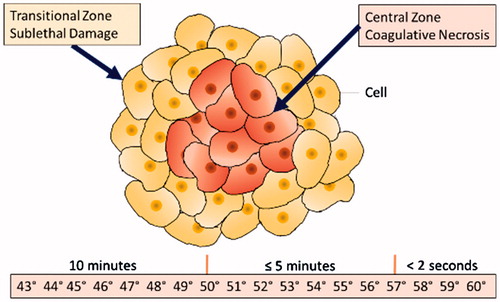
Figure 2. Tissue fixture for ablation data collection. Green arrows indicate the temperature probes, which are inserted into the tissue model perpendicular to each face.
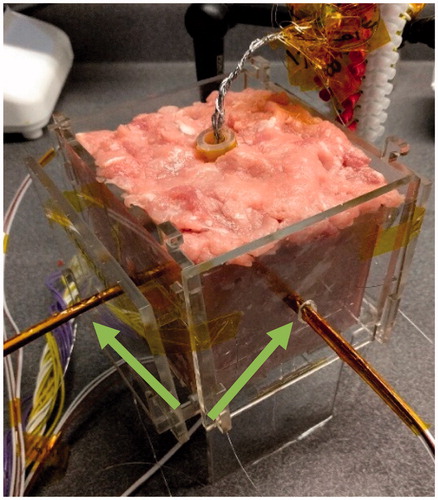
Figure 3. RFA device design with six faces, each corresponding to a clinical margin (left). Prototype with 4 electrodes per face and ring electrode at anterior face (right).
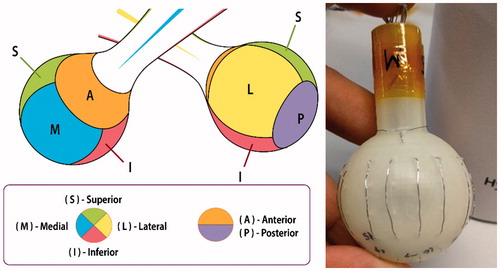
Figure 4. RF current flow and dataflow architecture of depth estimator training system.
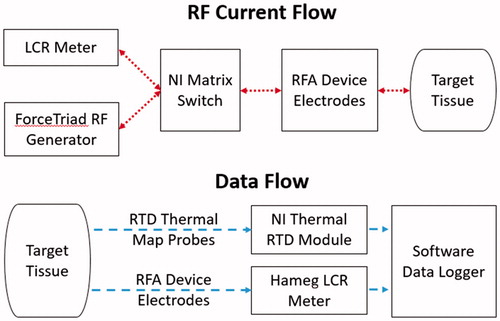
Figure 5. (a) Backpropagation-based multilayer perceptron training algorithm flowchart. (b) Architecture of the multilayer perceptron used for depth estimation.
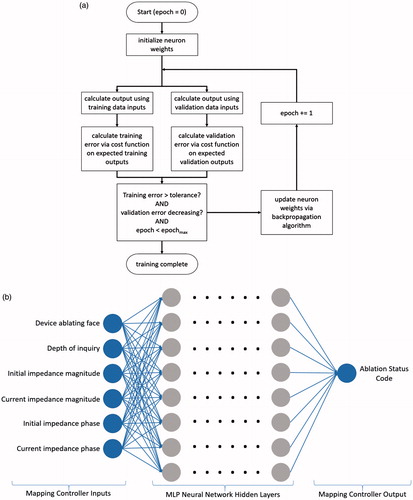
Figure 6. Sample depth-based impedance magnitude and phase training data.
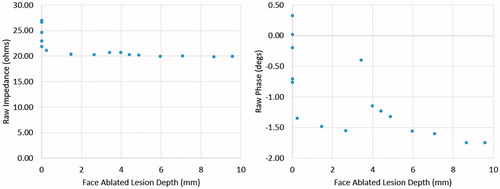
Figure 7. (a) Ablation controller software architecture flowchart. (b) Timing diagram of how ablation, measurement, and computation occur.
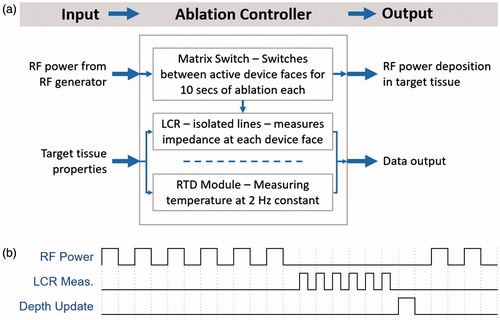
Figure 8. Training convergence plot for 80-10-10 training-validation-test split.
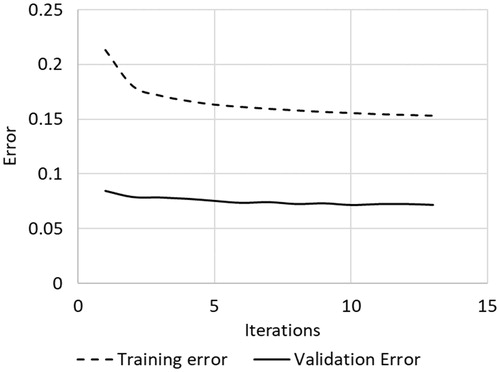
Figure 9. Final trained accuracy of MLP classifier as used for control system.
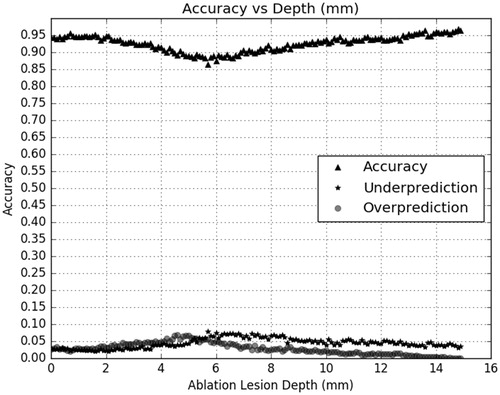
Table 1. Output statistics for multilayer perceptron when trained using 80%-10%-10% train-validate-test data set split. Statistics are based on using the 10% testing data split.
Table 2. Output statistics for multilayer perceptron when trained using 70%-0%-30% train-validate-test data set split. Statistics are based on using the 30% testing data split.
Figure 10. Illustration of how tissue is sectioned for macroscopic analysis.
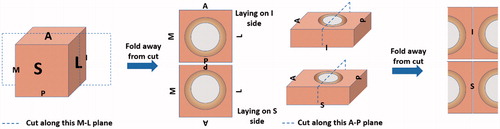
Figure 11. Ablation sample showing the desired deeper lesion depth in two device faces and uniform lesion depths in four other device faces. Scale legends are on images.
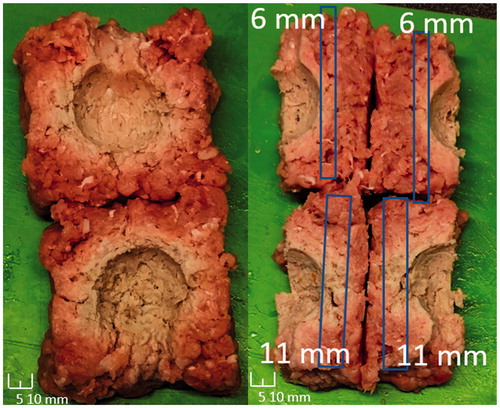
Table 3. Overall depth estimator-based control testing results, where the difference is between the target ablation depth and the system-controlled ablation depth.
Table 4. Overall depth estimator-based control testing results by target depth, where the difference is between the target ablation depth and the system-controlled ablation depth.