Figures & data
Table 1. A summary of volunteer information, anatomical sites selected for MR thermometry (number of scans at each site in brackets), and thermometry duration.
Figure 1. (A) Illustration of the locations of the MR thermometry slices. A sagittal T2-weighted MR image of the leg muscle is shown along with an illustration of the nominal location of the HIFU focus. The three vertical dashed lines indicate the temperature monitoring slices in the coronal plane with the middle one shown in (B). (C) Temperature evolution of a voxel at the focus before (solid line) and after (dotted line) drift correction. (D) Histogram of the drift-corrected temperature curve shown in (C) to demonstrate the calculation of temperature accuracy and precision for each voxel. The precision was quantified by the standard deviation of the measured temperature change over all dynamics. The accuracy of thermometry was evaluated by the relative temperature change measured directly by MR thermometry throughout the whole scan, indicating the degree of closeness of the measured temperature change to the true temperature change value (i.e. 0 °C as no heating was applied).
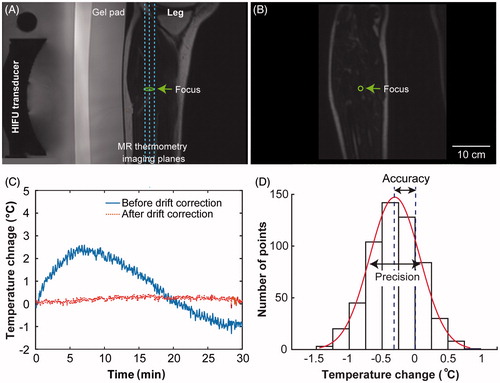
Figure 2. Representative MR temperature maps (coronal plane) of the chest wall, bladder wall, and leg muscle shown next to the corresponding magnitude images. The solid lines indicate the perimeter of the region of interest (ROI). In Figure 2 C, the voxels with high-signal intensity observed on the left side the bladder (indicated by an arrow) showcase urine filling to the bladder.
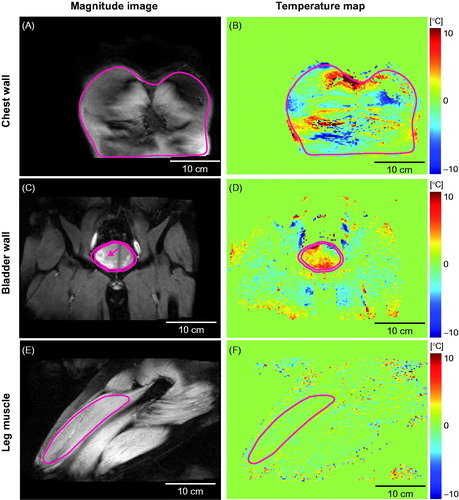
Figure 3. Temperature accuracy and precision maps for the chest wall, bladder wall, and leg muscle based on the MR temperature maps shown in .
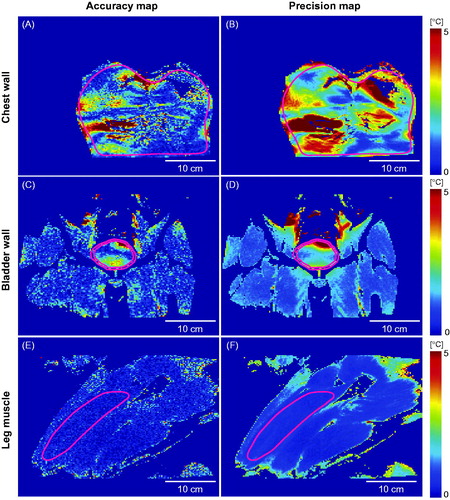
Table 2. Mean and standard deviation of temperature accuracy and precision of all MR thermometry scans at each anatomical location and scan time.
Figure 4. Quantification of MR thermometry (A) accuracy and (B) precision for the chest wall, bladder wall, and leg muscles. Precision and accuracy <1 °C (indicated by the dash lines) were used as criteria for acceptable thermometry. * denotes p < 0.05, ** denotes p < 0.01, *** denotes p < 0.001, and ns denotes p > 0.05.
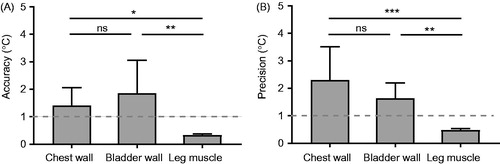
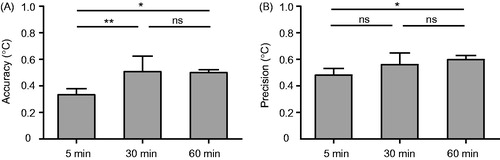
Figure 5. Comparison of MR thermometry (A) accuracy and (B) precision of 5-min, 30-min, and 60-min scans of leg muscles. * denotes p < 0.05, ** denotes p < 0.01, and ns denotes p > 0.05.