
Figures & data
Figure 1. Schematic diagram of index R. Index R was defended as the surface area of the unit volume (R = Ssurface/V). Between the baseline and first follow-up, volume and surface area reduction was observed after effective treatment. The increasing ratio reflected that volume decrease much faster than the surface area. The value of R reflected volume reduction of the lesion. Between the next follow-up the volume had no changes (V2 = V3), while the shape of lesion was different. With the same volume, oblate ellipsoid earned larger surface area. Index R could reflect shape changes. The surface area in per unit volume improved. Dmax of V2, V3 was shorter than V1 after MWA, whereas Dmax in next follow-up was much longer than in first ones. V0: Unit volume (constant); V1: baseline volume; Dmax: white dotted line; V2, V3: volume after MWA, V2 is equal to V3.
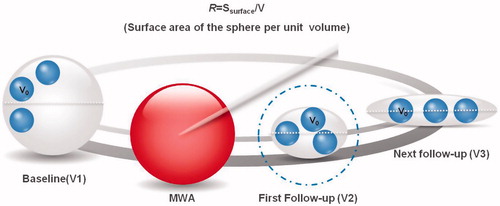
Table 1. Baseline characteristics of different groups.
Table 2. Changes of parameters before MWA and at each follow-up.
Figure 2. Multiple comparisons in the whole group before ablation and after each follow-up. After MWA, no statistically significant differences were observed in parameters like Dmax, V and VRR between the three-month and six-month follow-up periods. Similarly, between the 6-month and 12-month follow-up, the above parameters didn’t show any statistically significant differences. ns: No significance. Those which were not showed had statistical significance difference (p < 0.05). The blue dashed line contains parameters Dmax, V and VRR. The blue solid line shows the comparison.
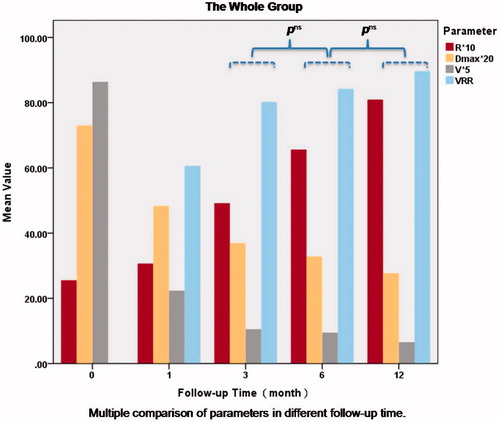
Figure 3. ROC curve of Dmax, V, VRR and index R at three-month follow-up. All parameters expressed effective treatment after MWA within three-month whether comparing with the baseline or the former follow-up. And the similar performance in treatment evaluation was obtained by ROC curve of these parameters.
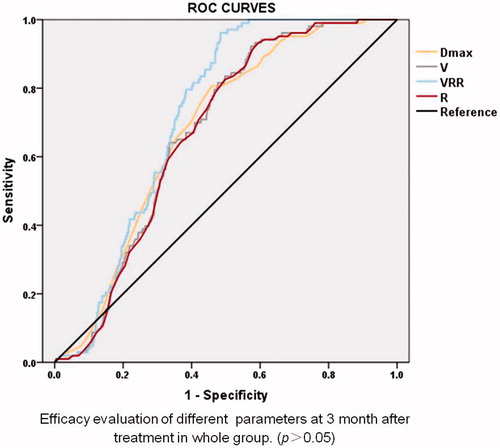
Figure 4. Multiple comparisons in the diameter group before ablation and after each follow-up. Between the 6-month and 12-month follow-up, whatever the initial diameter was, there were no statistically significant differences values of Dmax, V and VRR. And so did Dmax between the 3-month and 6-month follow-up. When the initial diameter >3.4 cm, the values of V and VRR showed no statistically significant differences in comparing with the next follow-up term, from 3-month to 12-month periods. ns: No significance. Those which were not showed had statistical significance difference (p < 0.05). The blue dashed line contains parameters Dmax, V and VRR. The red solid line contains parameters V and VRR. The yellow dashed line represents Dmax. The blue solid line shows the comparison.
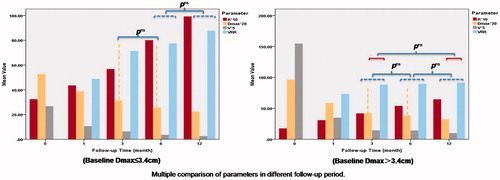
Figure 5. Receiver operating curve curve of V, VRR and index R at six-month follow-up in nodules baseline diameter ≤3.40 cm. V, VRR and index R reflected treatment effectiveness after MWA within six-month whether comparing with the baseline or the former follow-up. And the similar performance in treatment evaluation was obtained by ROC curve of these parameters.
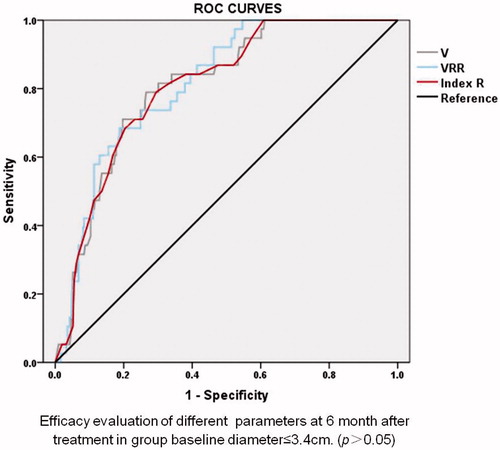
Figure 6. Multiple comparisons in the volume group before ablation and after each follow-up. After the three-month periods, whatever initial volume was, Dmax, V and VRR showed no statistically significant differences compared with the former or the next follow-up. ns: No significance. Those which were not showed had statistical significance difference (p < 0.05). The blue dashed line contains parameters Dmax, V and VRR. The blue solid line shows the comparison.
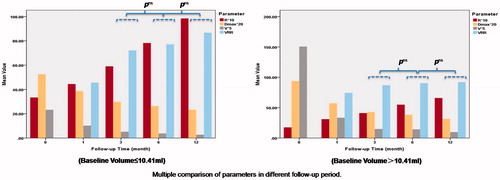
Figure 7. A 43-year-old man had a complex nodule in the left lobe. The changes of the nodules before and after MWA were presented in the following pictures. (a) Ultrasound examination revealed the Dmax, V and index R of the nodule were 3.7 cm, 10.20 ml and 2.36 before MWA. (b) One-month after the ablation, Dmax, V, VRR and index R of the nodule were 2.5 cm, 3.56 ml, 65.10% and 3.24, respectively. (c) Three-month after the ablation, Dmax, V, VRR and index R of the nodule were 1.3 cm, 0.44 ml, 95.69% and 6.54, respectively. (d) Six-month after the ablation, Dmax, V, VRR and index R of the nodule were 1.0 cm, 0.16 ml, 98.43% and 9.33, respectively. (e) At final 15-month follow-up of this patient, Dmax, V, VRR and index R of the nodule were 1.0 cm, 0.11 ml, 98.92% and 11.00, respectively. It shows more changes of shape rather than volume.

Table 3. Thyroid function before treatment and after one month of follow-up (p > 0.05).