Figures & data
Figure 1. Schematic of laser delivery and of temperature measuring systems. These include the delivery fibre which guides the high-power laser beam (A) emitted by means of a diode-based laser source (B) to the 1 cm emitting area (drawing not in scale), the temperature fibre Bragg grating sensor (C), and the optical interrogator (D). The tips of the delivery fibre and of the FBG are bound together by a glass capillary (E). A laptop (F) is used to control the laser system.
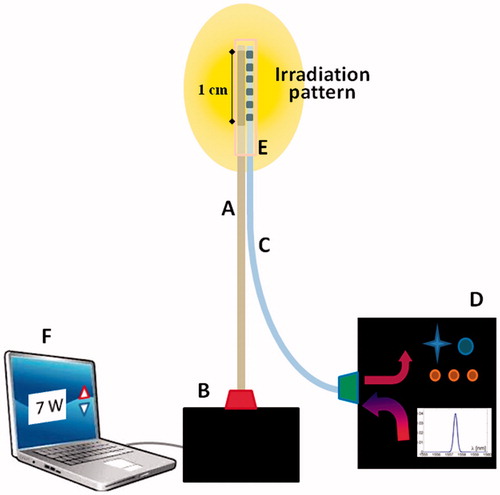
Figure 2. Schematic of biliary tree anatomy (A). Laser applicator insertion into the common bile duct through a 1 cm longitudinal incision (B) and LA (C). Pictures were taken using the snapshot function of the laparoscopic camera.
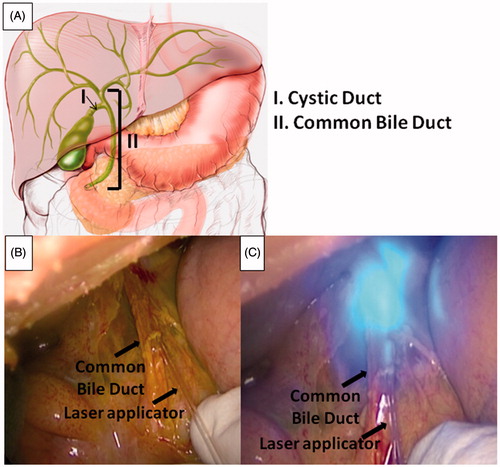
Figure 3. Normal histological structure of the common bile duct. The most superficial layer is organised as a single columnar epithelium, composing pleats and folds (black arrow). The underlying portion is made up of a dense connective tissue (*) (A). Normal histological structures of the cystic duct. The surface epithelium is composed of tall, uniform and columnar cells (black arrow). Deeper circular, longitudinal and oblique smooth muscle fibres without distinct layers can be identified (*) (C). Coagulative necrosis of the most superficial portion can be observed for both the common bile duct and cystic duct with rare craters induced by the ablation. Wall integrity turned out to be preserved in both cases (B) and (D).
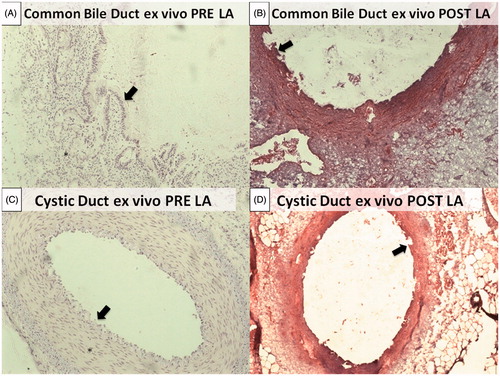
Figure 4. Temperature trend during LA in the common bile duct (A) and the cystic duct (B) at 7 W for 3 min, and in the common bile duct (C) and the cystic duct (D) at 7 W for 6 min.
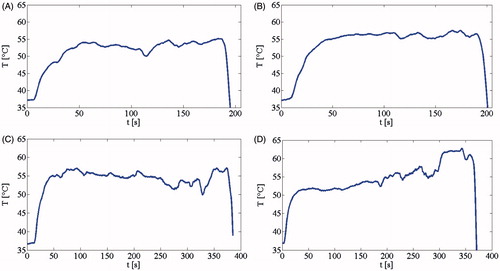
Table 1. Mean temperature values after 50 s from turning the laser on (expressed as mean value ± standard deviation), and diameters of the ducts, expressed as follows: (major axis/2) × (minor axis/2) and equivalent diameter (ED).
Figure 5. Histological samples of common bile duct after H&E (A) and NADH (B) staining at 3 min, and H&E (C) and NADH (D) staining at 6 min. Histological samples of the cystic duct after H&E (E) and NADH (F) staining at 3 min, and H&E (G) and NADH (H) staining at 6 min (Zeiss Axiophot, 5x enlargement). In B, D, and E the dark (blue) zones correspond to the vital tissue left after the ablation.
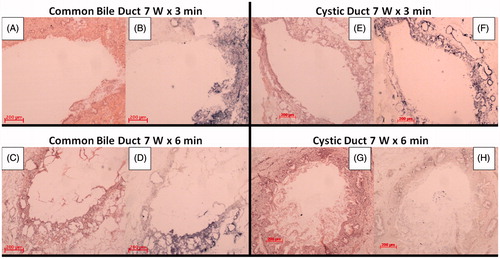
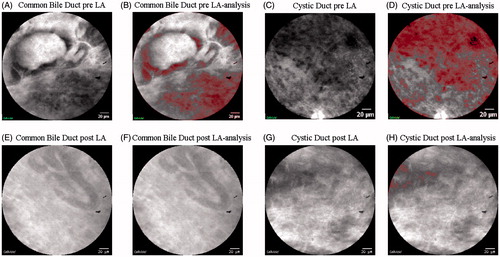
Figure 6. Confocal images acquired before (A) and after (E) LA in the common bile duct, and before (C) and after (G) ablation in the cystic duct. Image analysis evidenced the red mask plotted in correspondence to the cells visible in the images before (B) and after (F) LA in the common bile duct and before (D) and after (H) LA in the cystic ducts.