Figures & data
Figure 1. Study population and distribution of histological subtypes.
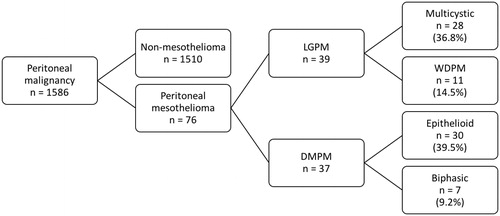
Table 1. Demographic and surgical characteristics of 76 peritoneal mesothelioma patients.
Figure 2. Kaplan–Meier curves for overall (A) and disease-free (B) survival for patients with low-grade peritoneal mesothelioma (LGPM) and diffuse malignant peritoneal mesothelioma (DMPM).
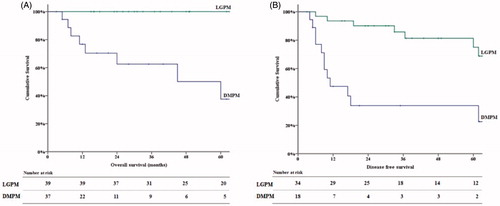
Table 2. Survival outcomes after complete cytoreduction by histological subtype.
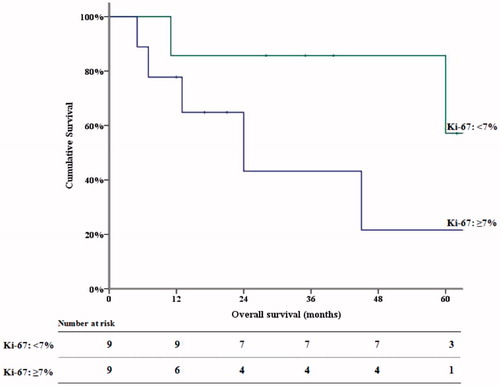
Figure 3. Kaplan–Meier curve showing significant difference in overall survival after complete cytoreduction between DMPM patients with high or low Ki-67 proliferation index.