
Figures & data
Figure 1. (a) Geometry and dimensions of the liver model used in this study (the dimensions in brackets are in mm) and (b) the boundary conditions implemented. The red point in (b) indicates the point where the temperature is probed for the implementation of the PID controller.
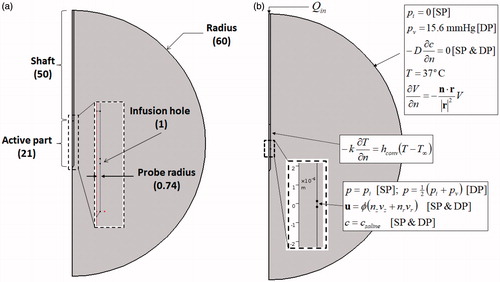
Table 1. Hydraulic and transport parameters used in the present study.
Table 2. Thermal, electrical and cell death parameters used in the present study.
Figure 2. Penetration depth of saline after 10 min of infusion in the SP and DP (interstitium and vasculature) models obtained for the pre-infusion mode.
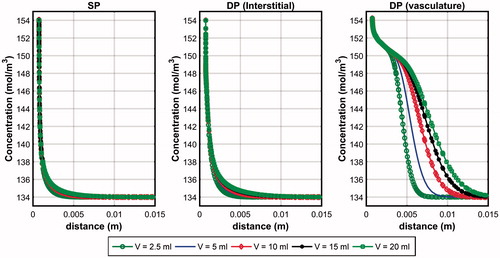
Figure 3. Contours of the temperature distribution 10 min after pre-infused RFA of the (a) SP and (b) DP models. Regions within the white lines represent zones where tissue vapourisation occurs.
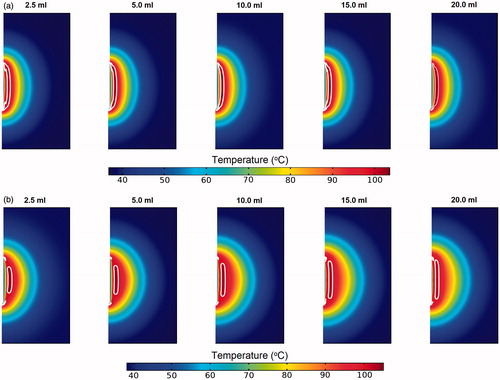
Figure 4. Coagulation zone formation following saline infused RFA with pre-infusion of saline obtained using the (a) SP and (b) DP models.
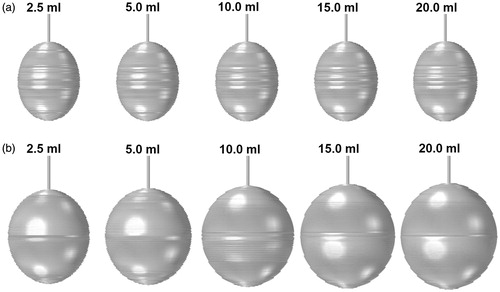
Table 3. Comparisons of the coagluation volumes (cm3) obtained using the SP, DP and SP (with vascular permeability) models.
Figure 5. Penetration depth of saline after 10 min of infusion in the SP and DP (interstitium and vasculature) models obtained for the simultaneous infusion mode. Color legend is similar to that in .
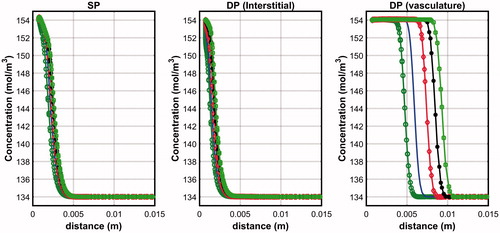
Figure 6. Contours of the temperature distribution 10 min after simultaneous-infused RFA of the SP and DP models. Regions within the white lines represent zones where tissue vapourisation occurs.
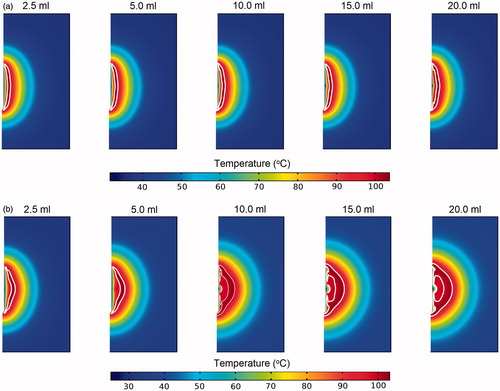
Figure 7. Coagulation zone formation following saline infused RFA with simultaneous-infusion of saline obtained using the SP and DP models.
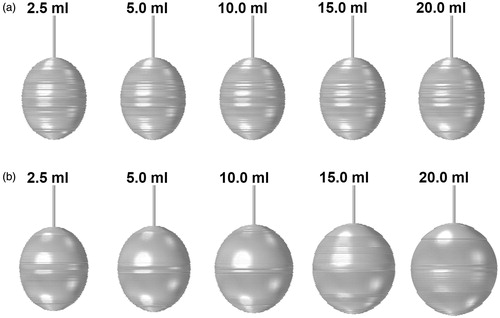
Figure 8. Comparison between the saline penetration depth obtained using the new SP model and the DP model (vasculature only) for (a) pre-infusion and (b) simultaneous-infusion protocols. Colour legend is similar to that in Figure 2.
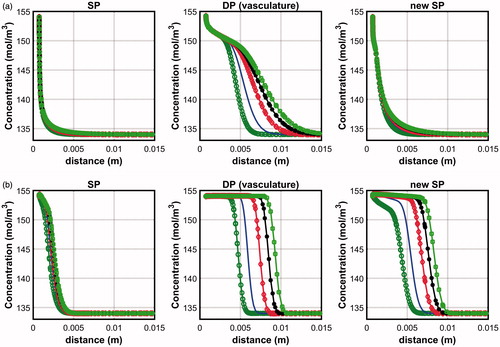
Table 4. Comparison of the coagulation zone radius of the SP and DP model against experimental studies of Cha et al. [Citation23].