
Figures & data
Table 1. Population studied.
Figure 1. Longitudinal scan of toxic nodule before (AP 23 mm × TR 32.5 × LG 39 mm; volume 15.2 ml) and after 6 months (AP 15 mm × TR 22.5 mm × LG 29; volume 5.1 ml) of single session of LA.
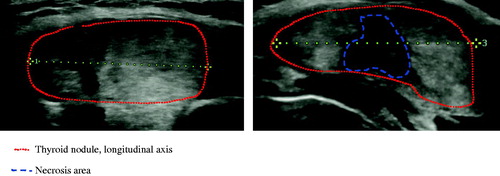
Table 2. Volume reduction and hormonal changes at different times.
Table 3. Correlation between initial volume of toxic nodule and therapeutic response (suspension of methimazole) with volume reduction ratio.