
Figures & data
Table 1. Baseline characteristics of the patients with adenomyosis.
Figure A1–4. (A1) MRI T2WI before the HIFU procedure. (A2) MRI contrast enhancement before the HIFU procedure. (A3) MRI T2WI after the HIFU procedure. (A4) MRI enhancement of the non-perfusion area after the HIFU procedure.
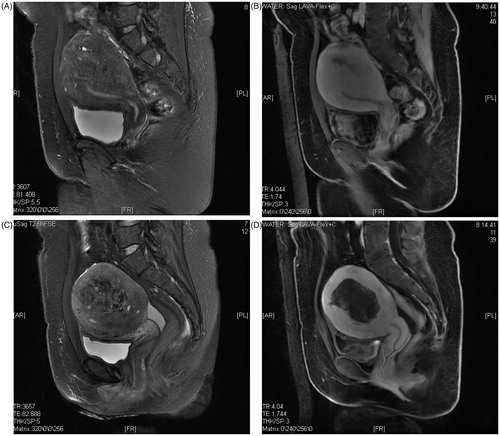
Figure B1–2. (B1) CEUS image before the HIFU procedure. (B2) CEUS image immediately after the HIFU procedure.
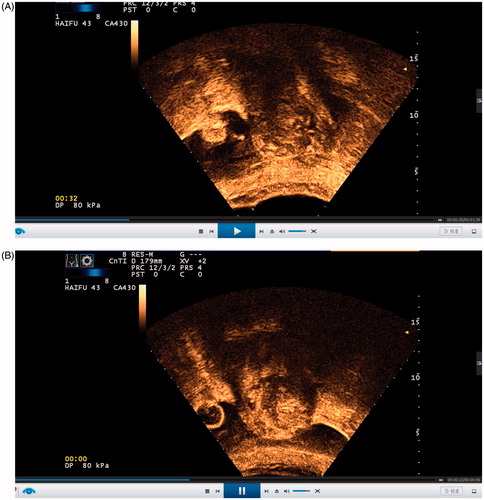
Figure 3. Consort HIFU/HIFU-GnRH Flow Diagram.
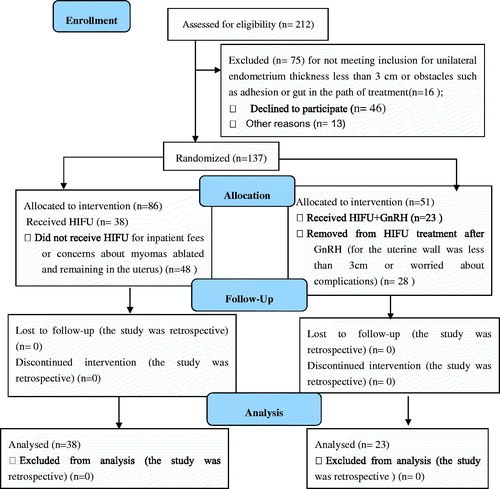
Table 2. Comparison of the volumes of the uterus and lesions in the pre-treatment group before and after treatment with GnRH.
Table 3. Comparison of HIFU outcomes between the HIFU group and pre-treatment group.
Table 4. Comparison of intra-procedural and post-procedural adverse effects between the HIFU group and pre-treatment group.
Table 5. Comparison of the VAS and the relief rate between the HIFU-only group and HIFU + GnRH group from 3 months to 12 months after treatment.
Table 6. Comparison of the clinical effectiveness between the HIFU-only group and HIFU + GnRH group from 3 months to 12 months after treatment.