1,824
Views
25
CrossRef citations to date
0
Altmetric
Research Article

Hepatocellular carcinoma abutting large vessels: comparison of four percutaneous ablation systems

, , , , , , & show all
Pages 1171-1178 | Received 18 Oct 2017, Accepted 08 Feb 2018, Published online: 18 Apr 2018

Figures & data

Figure 1. Flow-chart. Among the 914 HCC treated, 352 were included. After matching, 40 HCC for each treatment group were retained for further analysis (N = 160).
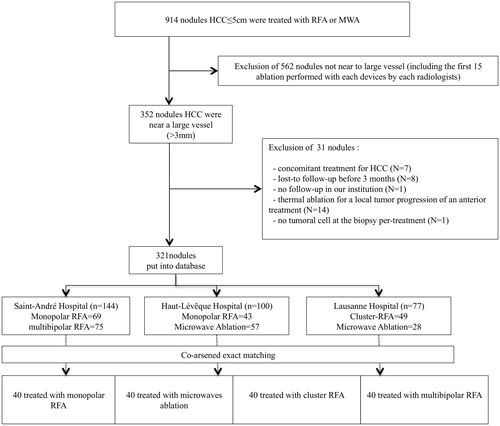
Figure 1. Flow-chart. Among the 914 HCC treated, 352 were included. After matching, 40 HCC for each treatment group were retained for further analysis (N = 160).

Figure 2. Illustration of the differences between the different ablation devices used to treat HCC abutting large vessel: (A) microwaves ablation; (B) monopolar RFA using a multi-tined electrode; (C) multi-bipolar radiofrequency ablation; and (D) cluster RFA.
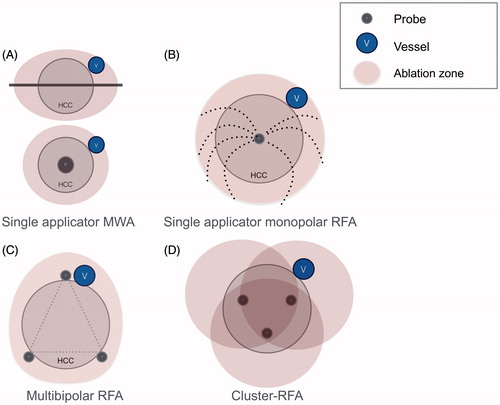
Figure 2. Illustration of the differences between the different ablation devices used to treat HCC abutting large vessel: (A) microwaves ablation; (B) monopolar RFA using a multi-tined electrode; (C) multi-bipolar radiofrequency ablation; and (D) cluster RFA.

Table 1. Baseline characteristics of patients and nodules treated either by single-applicator monopolar, cluster-RF, multi-bipolar radiofrequency, or microwave ablation.

Figure 3. Comparison of overall local tumour progression between monopolar RFA group (N = 40), MWA group (N = 40), Cluster-RFA group (N = 40) and multi-bipolar group (N = 40). Overall local tumour progression includes primary failure and local tumour progression. mbpRFA: multi-bipolar radiofrequency ablation.
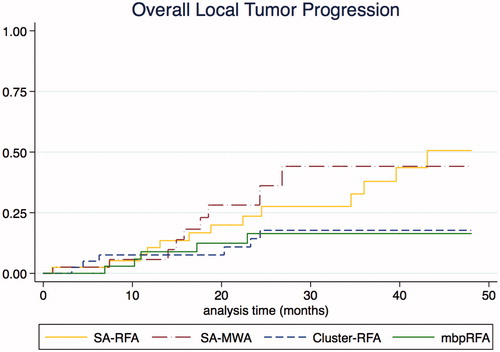
Figure 3. Comparison of overall local tumour progression between monopolar RFA group (N = 40), MWA group (N = 40), Cluster-RFA group (N = 40) and multi-bipolar group (N = 40). Overall local tumour progression includes primary failure and local tumour progression. mbpRFA: multi-bipolar radiofrequency ablation.

Table 2. Predictive factors of overall local tumour progression (LTP and primary treatment failure).

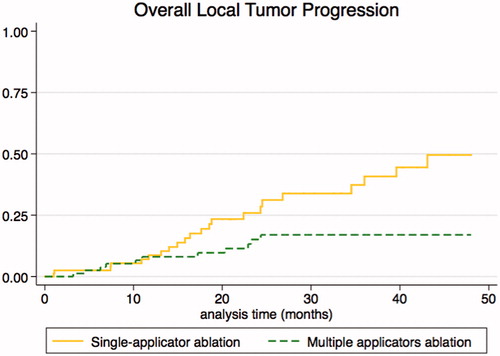
Figure 4. Comparison of overall local tumour progression between single-applicator group (N = 80) and multi-applicator group (N = 80). Overall local tumour progression includes primary RFA failure and local tumour progression.

Figure 4. Comparison of overall local tumour progression between single-applicator group (N = 80) and multi-applicator group (N = 80). Overall local tumour progression includes primary RFA failure and local tumour progression.

Reprints and Corporate Permissions

Please note: Selecting permissions does not provide access to the full text of the article, please see our help page How do I view content?

To request a reprint or corporate permissions for this article, please click on the relevant link below:

Academic Permissions

Please note: Selecting permissions does not provide access to the full text of the article, please see our help page How do I view content?

Obtain permissions instantly via Rightslink by clicking on the button below:

If you are unable to obtain permissions via Rightslink, please complete and submit this Permissions form. For more information, please visit our Permissions help page.