Figures & data
Table 1. Demographic characteristics of the subjects.
Figure 1. Hydrodissection by continuous injection. (a) Surgical assistant injects a mixture of 1% lidocaine and physiological saline solution into the surrounding thyroid capsule by continuous injection (volume: 50 ml, speed: 10–20 ml/min) during the ablation period, (b) achieving ‘hydrodissection’ (arrow) to protect the vital organs from thermal injury. (c) At the beginning of ablation, an MWA antenna was inserted into the nodule’s lower pole.
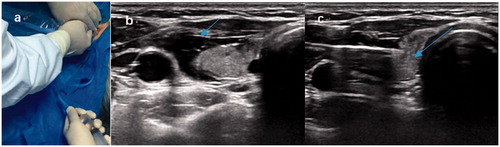
Figure 2. (a) Longitudinal ultrasound image demonstrating a 5 × 6×8 mm hypoechoic nodule with an irregular margin and microcalcifications located in the right thyroid lobe. (b) Contrast-enhanced ultrasound (CEUS) of the nodule showing irregular hypoenhancement. (c) Ultrasound showing a heterogeneous hypoechoic area with hyperechoic foci 1h after the end of MWA. (d) CEUS was performed to evaluate the 14 × 14 × 17 mm extensive ablation area 1 h after MWA.
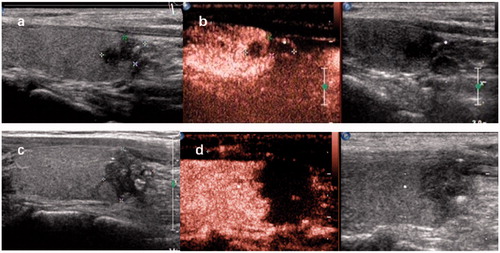
Table 2. Overall comparison of surgery versus MWA.
Table 3. Complications observed following surgery versus MWA.
Figure 3. Microwave ablation (MWA) treatment and follow-up of one case of papillary thyroid microcarcinoma (PTMC). (a) Longitudinal ultrasound image demonstrating a 3 × 3×4 mm hypoechoic nodule with an irregular margin located in the left thyroid lobe before MWA. (b) One month after MWA, the ablation area was 10 × 10 × 9 mm and showed a well-defined margin. (c) Two years after MWA, the ablation area shrank to 2 × 8×1 mm with a well-defined margin. (d,e) CEUS showing a heterogeneous hypoechoic pattern.
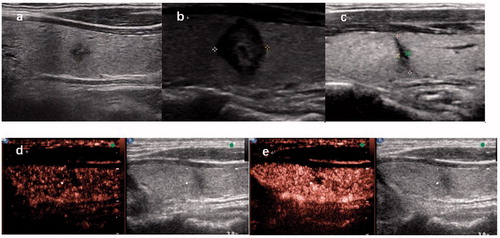
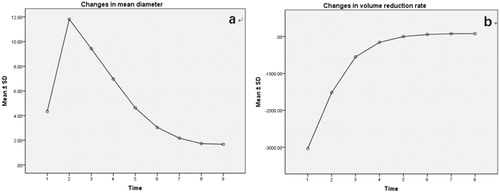
Table 4. Changes in mean diameter (mm) before and 1, 3, 6, 12, 18, 30, and 42 months after MWA.
Table 5. Changes in nodule volume and volume reduction rate (mm3) before and 1 hour, and 1, 3, 6, 12, 18, 30, 42 months after MWA.
Figure 4. (a) Changes in mean diameter at each follow-up. (b) Changes in volume reduction ratio at each follow-up.