Figures & data
Table 1. Demographics and variables collected.
Table 2. Univariate logistical analyses with odds ratios.
Table 3. COREP and modified COREP scoring systems.
Table 4. Comparison of four prognostic scoring systems with univariate and multivariable logistical analyses and cox-proportional hazards analyses (n = 104).
Figure 1. Overall survival of 3 prognostic groups according to the mCOREP score (n = 104).
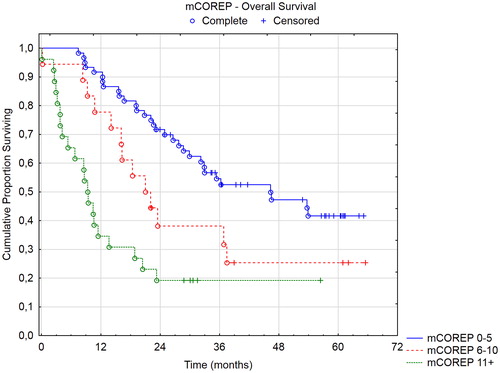
Figure 2. Recurrence free survival of 3 prognostic groups according to the mCOREP score (n = 104).
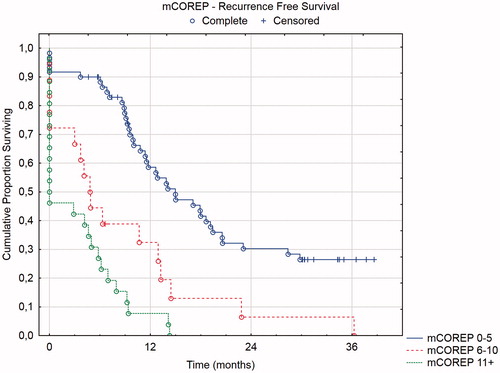
Figure 3. Overall survival of 4 prognostic groups according to the PSDS score (n = 128).
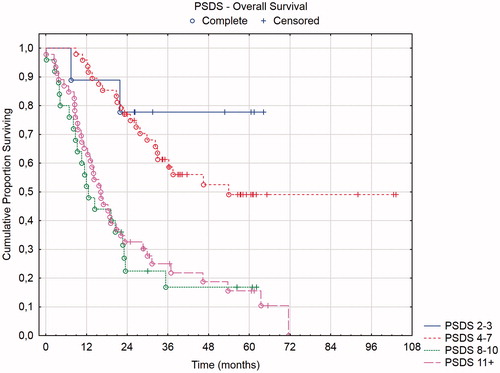
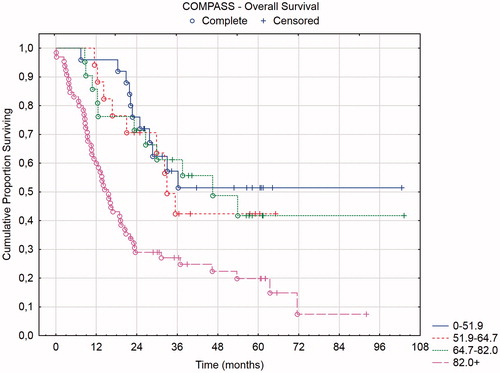
Figure 4. Overall survival of 4 prognostic groups according to the COMPASS score (n = 128).