Figures & data
Figure 1. Typical placement of superficial temperature sensors in a previously irradiated area during a superficial hyperthermia treatment of a patient with recurrent breast cancer. (A) At the AMC, multiple 7-point thermocouple probes are placed in the target region, three or four probes are placed in areas with low perfusion, such as the surgical scar (red dashed line), and the remaining probes are spread out over the target region. (B) Most other users spread limited single temperature sensors to maximize coverage of the target area.
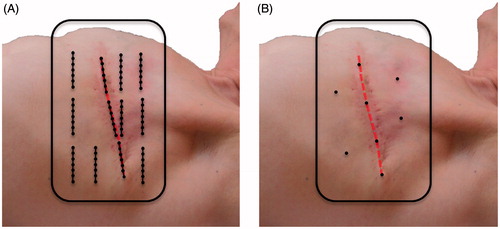
Figure 2. Patient inclusion/exclusion flowchart.
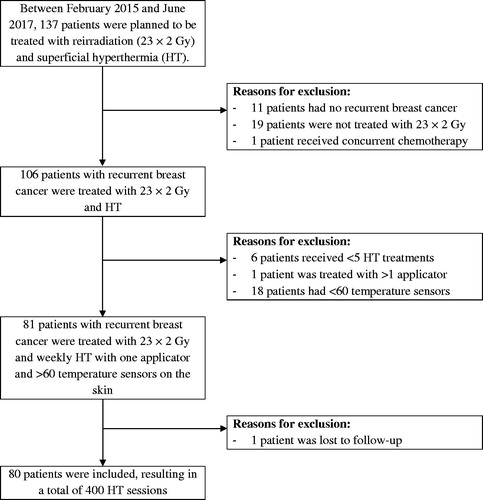
Figure 3. Simulation steps for thermal mapping and stationary sensors subsets.
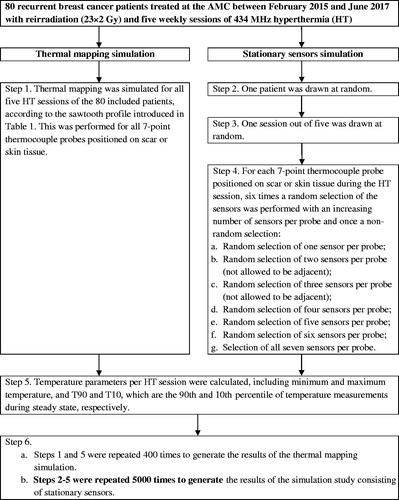
Table 1. The selection of the first 20 temperature measurements to simulate thermal mapping with thermal profiles using clinical data from stationary 7-point thermocouple probes.
Figure 4. Tukey boxplots of the temperature difference (ΔT) between randomly selected subsets (5000 simulations) and the complete set of sensors during a HT session. The ΔT Tukey boxplot for the thermal profile analysis that represents thermal mapping (TM) is displayed separately (400 simulations). The median (red horizontal line), 25th and 75th percentiles (lower and upper limits of the rectangular box), as well as the 95% confidence intervals (bracketed vertical lines) of the maximum temperature (Tmax), T10, T90 and minimum temperature (Tmin) are displayed for an increasing number of randomly selected temperature sensors in patients with recurrent breast cancer. The median number of stationary sensors analyzed per bin was 110,983 (range 1386–259,041).
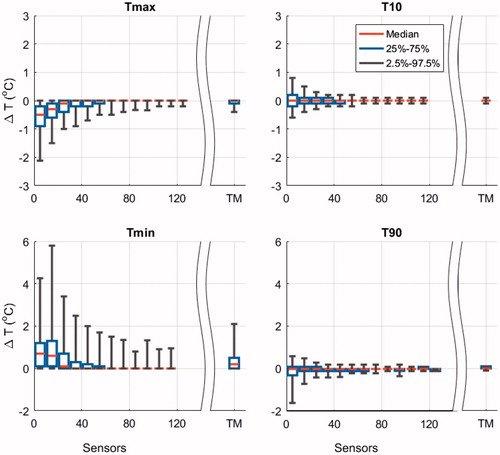
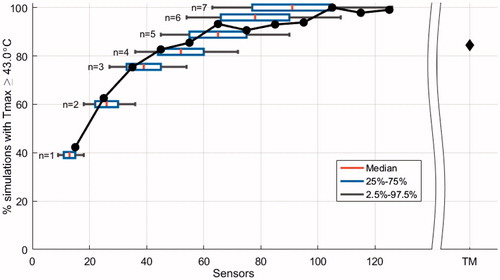
Figure 5. Normalized percentage of simulations that identify a maximum temperature (Tmax) ≥ 43.0 °C (2524 simulations) as a function of randomly selected sensors. The result of thermal profiles, which represents thermal mapping (TM), is displayed separately (85%; 200 simulations). Tukey boxplots show the median (red vertical line), 25th and 75th percentiles (lower and upper limits of the rectangular box), as well as 95% confidence intervals (bracketed horizontal lines) of the number of sensors when n sensors per 7-point probe are selected. The solid circles represent the results per interval of sensors in bins of 10. The median number of stationary sensors analyzed per bin was 51,589 (range 1656–119,510).