Figures & data
Table 1. Patient demographics and radiofrequency ablation (RFA) technique.
Table 2. Distribution of FDG PET scans at various timepoints following RFA.
Figure 1. Mean SUVmax_normalized with maximum and minimum range bars (black dots, short lines) and total lesion glycolysis (bars, triangles) of lung cancers at baseline and subsequent timepoints at radiofrequency ablation zones (in months post-treatment) among non-recurrent sites. *Please note that two patients, both with intense and increasing focal uptake at last available PET follow up but no findings on CT confirming recurrence are considered non-recurrent by previously established methodology, and are not included in figure.
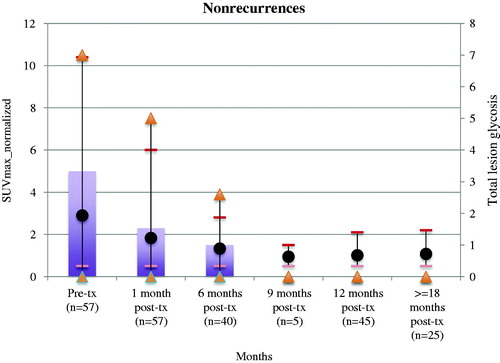
Figure 2. FDG PET pitfall. (Top) FDG PET/CT 1 month post-radiofrequency ablation with electrodes shows expected ring of intense uptake along periphery of treated right upper lobe cancer and inflammatory soft tissue by CT. (Middle) FDG PET/CT 6 months post-RFA showed focal intense uptake centrally within the treatment zone that is modestly higher in magnitude compared to immediate prior PET. There is contracting soft tissue by CT. (Bottom) FDG 13 months post-RFA shows non-focal moderate uptake (similar to mediastinal background) at treatment site. Soft tissue at treatment site is stable by CT.
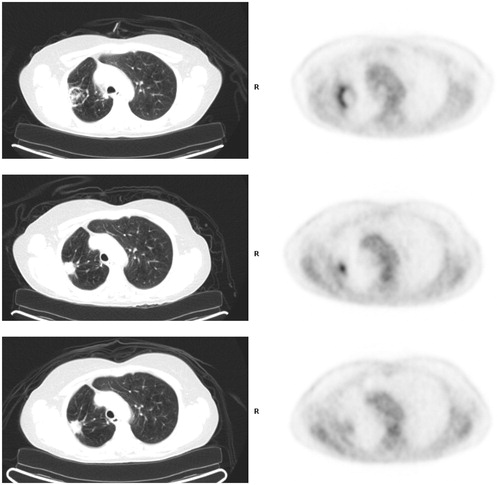
Figure 3. Lung cancer recurrence. (Top) FDG PET/CT 1 month post-RFA shows low level uptake at treatment site in the left upper lobe. (Middle) FDG PET 7 months post-RFA shows focal intense uptake at ablation zone (increased compared to immediate post-RFA FDG PET), suspicious for recurrence. Concurrent diagnostic CT showed no evidence for recurrence, and possibly even slightly contracted soft tissue. (Bottom). Follow up diagnostic CT 10 months post-RFA showed enlargement of soft tissue at ablation zone, confirming recurrence.
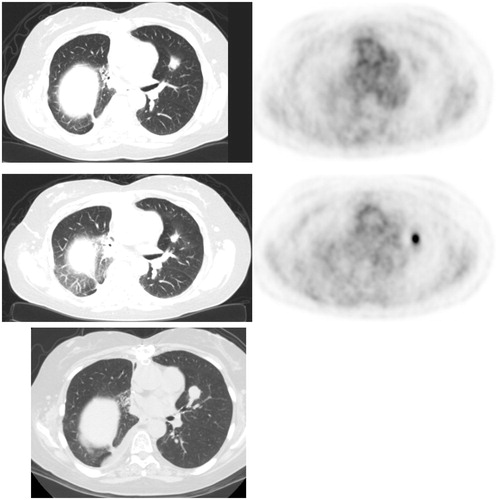
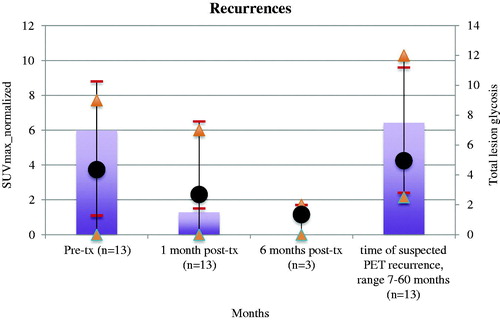
Figure 4. Mean SUVmax_normalized with maximum and minimum range bars (black dots and short lines) and total lesion glycolysis (bars, triangles) of lung cancers at baseline and subsequent timepoints at radiofrequency ablation zone (in months post-treatment) at sites of ultimate recurrence.