Figures & data
Table 1. Baseline characteristics of patients undergoing microwave ablation.
Figure 1. (a) US scan during ablation with tumor (thick arrows) adjacent to the bowel (thin arrow) that distance between tumor margin and renal pelvis <5 mm as measured by US. (b) US scan local separation of the liquid (thin arrow) between the tumor (thick arrows) and the bowel during hydrodissection. (c) US scan during ablation antenna was percutaneously inserted into the tumor and placed at the desired location. (d) US scan during ablation the heat-generated hyperechoic water vapor did completely encompass the entire tumor.
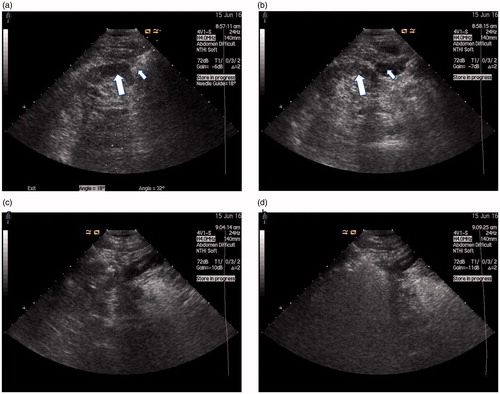
Figure 2. Overall survival curve between local tumour progression (LTP) and LTP free patients with renal cell carcinoma (RCC) treated with microwave ablation (MWA). There is no significant difference between the two groups (p = 0.38).
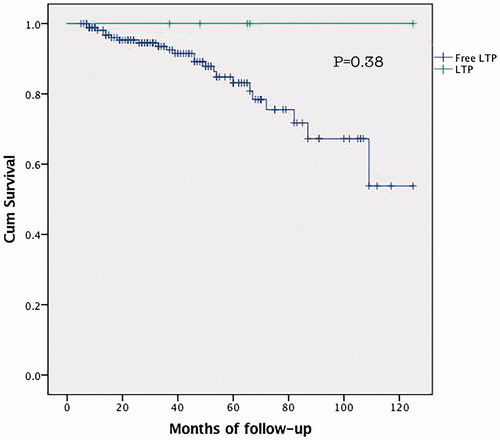
Figure 3. (a) Axial contrast-enhanced T1-weighted fat saturation MR image shows exophytic 2.7 cm clear cell RCC (arrow) located in safe location. (b) Axial contrast-enhanced T1-weighted fat saturation MR image shows no enhancement for nodular areas after US-guided percutaneous MWA. (c) (d) Axial contrast-enhanced T1-weighted fat saturation MR image and Axial contrast-enhanced CT obtained 30 months after MWA. A LTP nodular occurred in the anterior deep part of the ablation area.
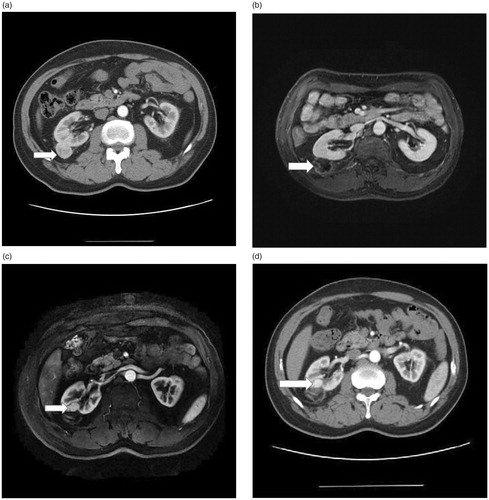
Table 2. Univariate analysis of risk factors associated with local tumor progression treated by MWA.
Table 3. Independent risk factors associated with local tumor progression with Cox Proportional Hazards Model.
Table 4. Local tumor progression cease characteristic after MWA/RFA/LCA of renal malignancies.
Table 5. Local tumor progression studies after MWA/RFA/LCA of renal malignancies for stage of T1a reported since 2007.
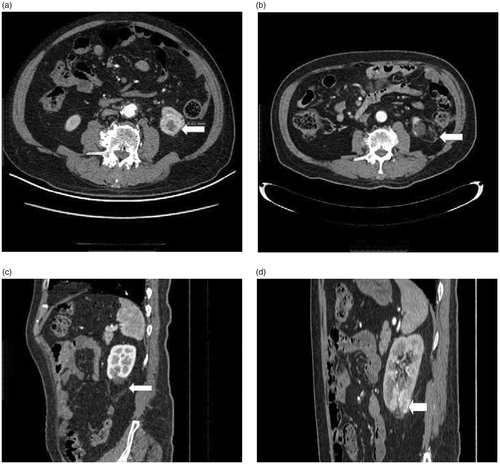
Figure 4. (a) Axial contrast-enhanced CT image shows exophytic 2.6 cm clear cell RCC (arrow) located in dangerous location (The edge of the tumor is 0.5 cm from bowel). (b) (c) Axial and sagittal contrast-enhanced CT image shows no enhancement for nodular areas after US-guided percutaneous MWA. (d) sagittal contrast-enhanced CT image obtained 29 months after MWA. A LTP nodular occurred in the above of the ablation area.