Figures & data
Figure 1. Pictures of a bottle of medical quality CO2 (A) and of Veress needle connected with 60 ml syringe through a 3-way tap (B left) with zoomed view on the extremity of Veress needle (B right).
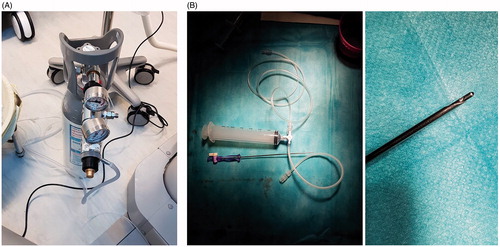
Figure 2. HCC (arrow) located in the dome (unvisible on US) on arterial T1-weighted MR image (A). PTA after HCC (arrow) tagging using lipiodol arterial injection and artificial CO2 pneumothorax (B). Follow-up 3 months after PTA showing the ablation zone (arrows) on subtraction T1-weighted MR image at the arterial phase (C).
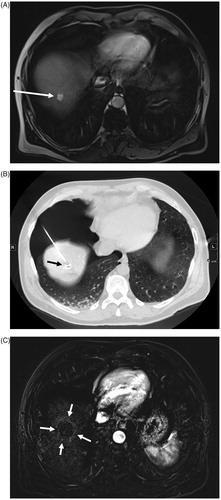
Figure 3. Consort Diagram.
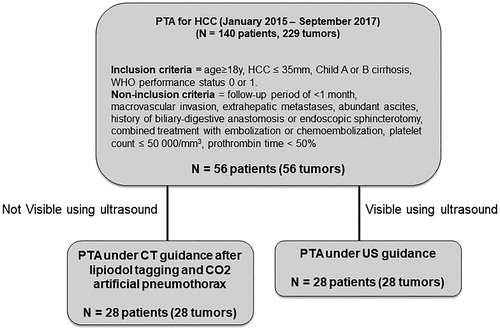
Table 1. Characteristics of the 56 included patients with HCC located at the hepatic dome.
Table 2. Outcomes of percutaneous thermal with CT-guidance after artificial CO2 pneumothorax compared to US-guidance.
Figure 4. Local Recurrence-Free Kaplan-Meier Survival curves between US-guidance and CT-guidance with artificial CO2 pneumothorax (p = NS).
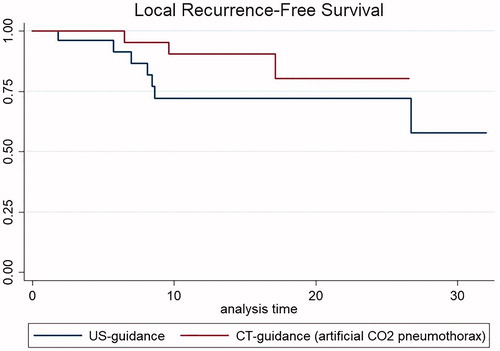
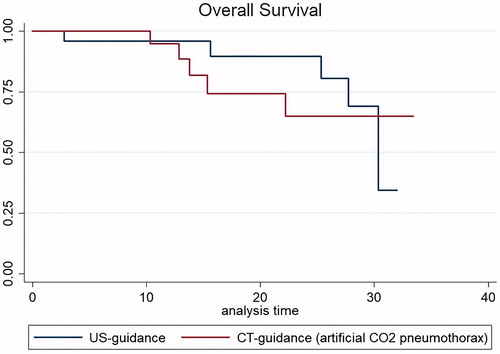
Figure 5. OS Kaplan-Meier curves between US-guidance and CT-guidance with artificial CO2 pneumothorax (p = NS).