Figures & data
Figure 1. Effects of FA on heat stress-induced intracellular ROS, SOD, MDA and NO changes in IEC-6 cells. (A and B) IEC-6 cells were pretreated with FA (0, 5, 10 and 20 μM) for 4 h in the presence or absence of 50 μM NAC for 1 h prior to exposure to heat stress (42 °C, 6 h). The cells were incubated with DCFH2-DA for 15 min. ROS generation was detected by a fluorescence microscope, and the fluorescence values of ROS were measured by using a fluorescence microplate reader (Scale bar =200 μm). (C, D and E) The cells were pretreated with FA (0, 5, 10 and 20 μM) for 4 h and then exposed to heat stress. The contents of SOD and MDA were determined by using commercial kits. The NO concentration in the supernatant was determined by the Griess reaction. Data are presented as the means ± SEM of three independent experiments. Statistical analysis was performed by using one-way ANOVA and Tukey’s test. *p < .05, **p < .01 compared to the control group; #p < .05, ##p < .01 compared to the heat stress-treated group.
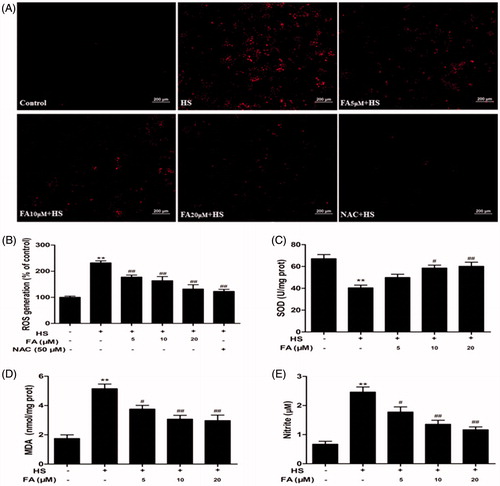
Figure 2. Effects of FA on HO-1 protein expression and intestinal TJ permeability changes in IEC-6 cells. (A) The cells were treated with FA (20 μM) for the indicated time periods (0, 1, 4, 8 and 12 h). (B) The cells were treated with the indicated concentrations (0, 5, 10 and 20 μM) of FA for 4 h. The cell lysates were subjected to Western blot analysis with an anti-HO-1 antibody. β-Actin was used as a loading control. (C) The cells were pretreated with ZnPP (10 μM) for 1 h prior to incubation with FA (20 μM) for 4 h, and then the proteins were extracted for Western blot analysis by using an anti-HO-1 antibody. (D) The cells were pretreated with ZnPP (10 μM) for 1 h and then incubated with or without FA (20 μM) for 4 h, followed by exposure to heat stress. The TER values were monitored across the IEC-6 cell monolayers by using Millicell-ERS. Data are presented as the means ± SEM from three independent experiments. Data are presented as the means ± SEM of three independent experiments. Statistical analysis was performed by using one-way ANOVA and Tukey’s test. *p < .05, **p < .01 compared to the control group; ##p < .01 compared to the heat stress-treated group; &&p < .01 compared to the FA-treated group.
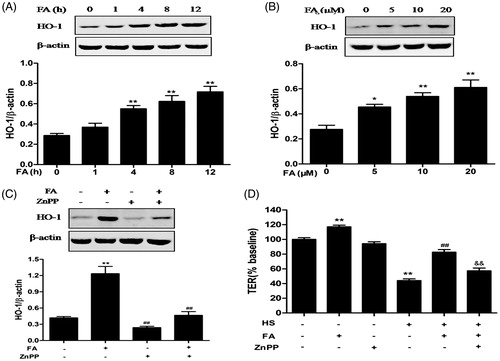
Figure 3. Effects of FA on Nrf2 nuclear translocation and PI3K/Akt phosphorylation in IEC-6 cells. (A and C) The cells were treated with FA (20 μM) for the indicated time periods (0, 1, 4, 8 and 12 h). (B and D) The cells were treated with the indicated concentrations (0, 5, 10 and 20 μM) of FA for 4 h. (A and B) The nuclear and cytosolic levels of Nrf2 were determined by Western blot analysis. PCNA was used as a nuclear loading control. Data are presented as the means ± SEM of three independent experiments. **p < .01 calculated versus control by using two-way ANOVA and Bonferroni’s post-test. (C and D) The cell lysates were subjected to Western blot analysis with anti-Akt or p-Akt antibodies. Data are presented as the means ± SEM of three independent experiments. *p < .05, **p < .01 calculated versus control by using one-way ANOVA and Tukey’s test.
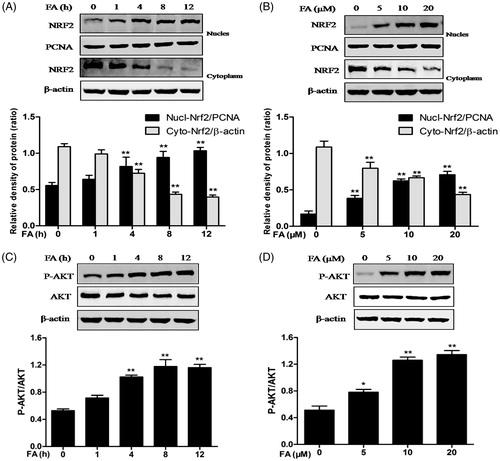
Figure 4. Effects of FA on occludin and ZO-1 protein expression and intestinal TJ permeability in IEC-6 cells. (A and C) The cells were treated with FA (20 μM) for the indicated time periods (0, 1, 4, 8 and 12 h). (B and D) The cells were treated with the indicated concentrations (0, 5, 10 and 20 μM) of FA for 4 h. (A and B) The cell lysates were subjected to Western blot analysis with an anti-occludin antibody. β-Actin was used as a loading control. (C and D) The cell lysates were subjected to Western blot analysis with an anti-ZO-1 antibody. β-actin was used as a loading control. Data are presented as the means ± SEM of three independent experiments. *p < .05, **p < .01 calculated versus control by using one-way ANOVA and Tukey’s test. (E) The cells on Transwell insert membranes were pretreated with FA (0, 5, 10 or 20 μM) at the indicated time points. The TER values were monitored across the cell monolayers. Data are presented as the means ± SEM of three independent experiments. Statistical analysis was performed by using two-way ANOVA and Bonferroni’s post-test. Means not sharing the same letter are significantly different from each other (p < .05).
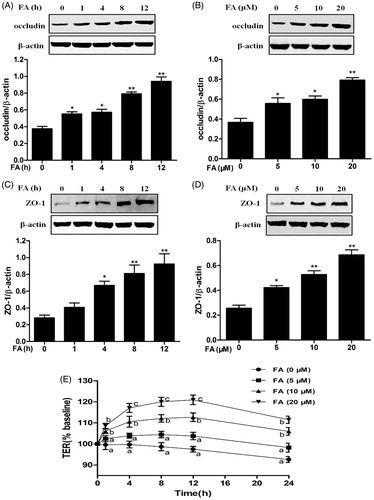
Figure 5. Effects of the PI3K/Akt pathway on FA-induced Nrf2 nuclear translocation and HO-1 expression. (A, B and C) IEC-6 cells were pretreated with 10 μM LY294002 for 1 h and then treated with 20 μM FA for 4 h. The levels of Nrf2, P-Akt and HO-1 protein were determined by Western blot analysis. PCNA was used as a nuclear loading control. Data are presented as the means ± SEM of three independent experiments. Statistical analysis was performed by using one-way ANOVA and Tukey’s test. **p < .01 compared to the control group; ##p < .01 compared to the heat stress-treated group.
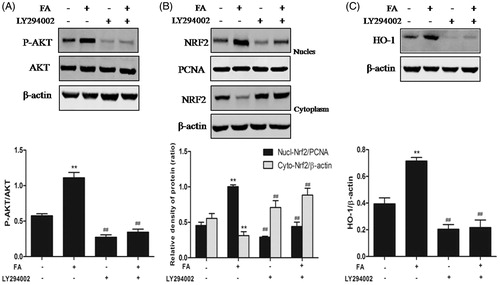
Figure 6. Effects of the PI3K/Akt pathway on FA-induced occludin and ZO-1 protein expression in IEC-6 cells. (A and B) IEC-6 cells were pretreated with 10 μM LY294002 for 1 h and then treated with 20 μM FA for 4 h. The levels of occludin and ZO-1 proteins were determined by Western blot analysis. Data are presented as the means ± SEM of three independent experiments. Statistical analysis was performed by using one-way ANOVA and Tukey’s test. **p < .01 compared to the control group; ##p < .01 compared to the heat stress-treated group.
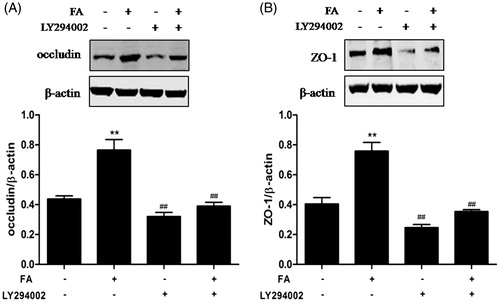
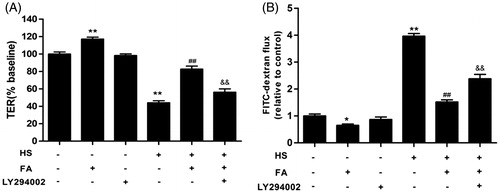
Figure 7. Effects of the PI3K/Akt pathway on the FA-mediated prevention of the heat stress-induced increase in intestinal TJ permeability in IEC-6 cell monolayers. (A and B) The cells on Transwell insert membranes were pretreated with or without 20 μM FA for 4 h in the presence or absence of 10 μM LY294002 for 1 h, followed by exposure to heat stress. (A) The TER values were monitored across the cell monolayers by using Millicell-ERS. (B) The permeability of FD4 across the cell monolayer was measured at 2 h after exposure to heat stress. Data are presented as the means ± SEM of three independent experiments. Statistical analysis was performed by using one-way ANOVA and Tukey’s test. **p < .01 compared to the control group; ##p < .01 compared to the heat stress-treated group; &&p < .01 compared to the FA-treated group.