Figures & data
Figure 1. Flow chart of patient enrollment.
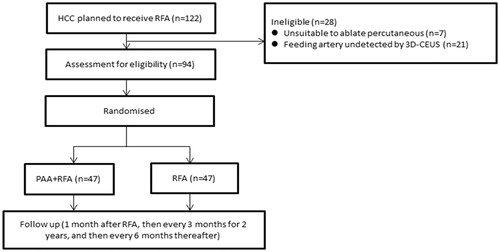
Table 1. Clinical characteristics of the HCC patients (n = 94).
Figure 2. Schematic diagram of percutaneous ablation of the tumor feeding artery. (Left) Two electrode needles were inserted parallel to the area where the artery entered the tumor. (Right) After blocking the feeding artery, the whole tumor was ablated.
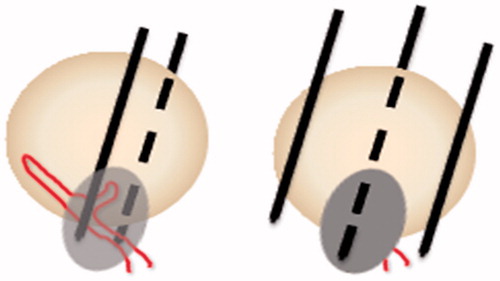
Figure 3. An 80-year-old woman with hepatocellular carcinoma at S4 was treated using PAA + RFA. (A) CT showed the tumor located at S4 with a 3.7-cm diameter. (B) Color Doppler ultrasound showed the feeding artery of the tumor. (C) CEUS showed that the tumor was hyper-enhanced in the arterial phase. (D) 3D-CEUS showed the feeding artery of the tumor (arrow). (E) The feeding artery and surrounding liver parenchyma were ablated by two electrode needles inserted parallel to each side of the artery. (F) Immediate CEUS showed that the tumor was under ischemic conditions. (G) Then, the whole tumor was coagulated under ultrasound guidance. (H) Enhanced CT 4 months after ablation showed that the tumor had completed necrosis.
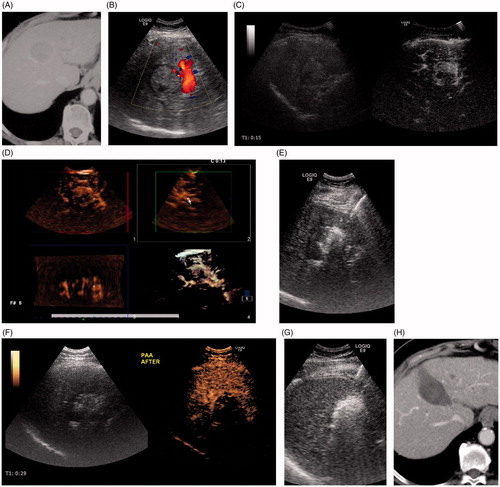
Figure 4. Local tumor progression rates in the PAA + RFA and RFA groups. The 1- and 3-year local tumor progression rates were 7.4% and 9.1% vs 22.1% and 22.1% in the PAA + RFA vs RFA groups (p = .066).
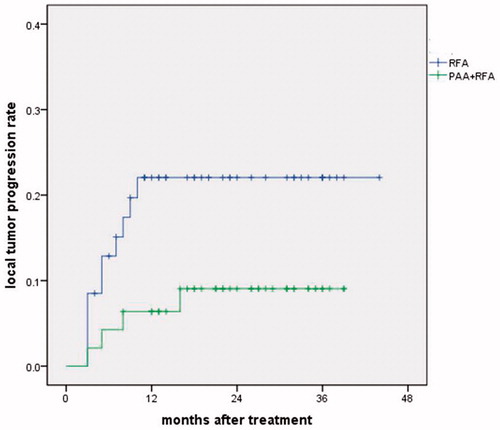
Table 2. Comparison of clinical outcomes after treatment.
Figure 5. Local tumor progression-free survival rates in the PAA + RFA and RFA groups. The 1- and 3-year local tumor progression-free survival rates were 91.5% and 69.9% vs 68.1% and 52.1% in the PAA + RFA vs RFA groups (p = .052).
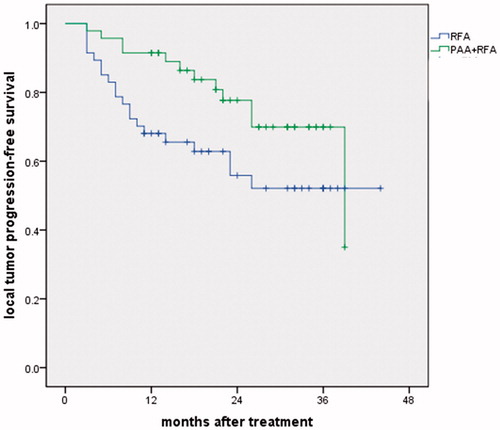
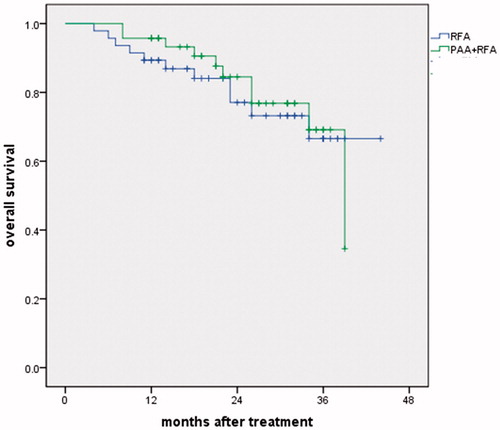
Figure 6. Overall survival rates in the PAA + RFA and RFA groups. The 1- and 3-year overall survival rates were 95.7% and 69.1% vs 89.4% and 66.6% in the PAA + RFA vs RFA groups (p = .744).